Southern Annular Mode (SAM)

A polar plot showing the Spatial Linear Patterns (SLP) with EOF 1, featuring blue and red shading to indicate varying pressure systems around Antarctica. Labels for 'ASL' and 'SAM' are included.
ASL is Amundson Sea Low

Like PNA, the Southern Annular Mode (also known as the Antarctic Oscillation) is considered random, or at best a teleconnection from some other index. I assume the annular in the name pertains to the dipole between the Antarctic core blob and the quasi-annular belt or ring around it. The SAM itself quantifies the north-south movement of this wind belt away from its normal location. The data goes back to the late 1950’s

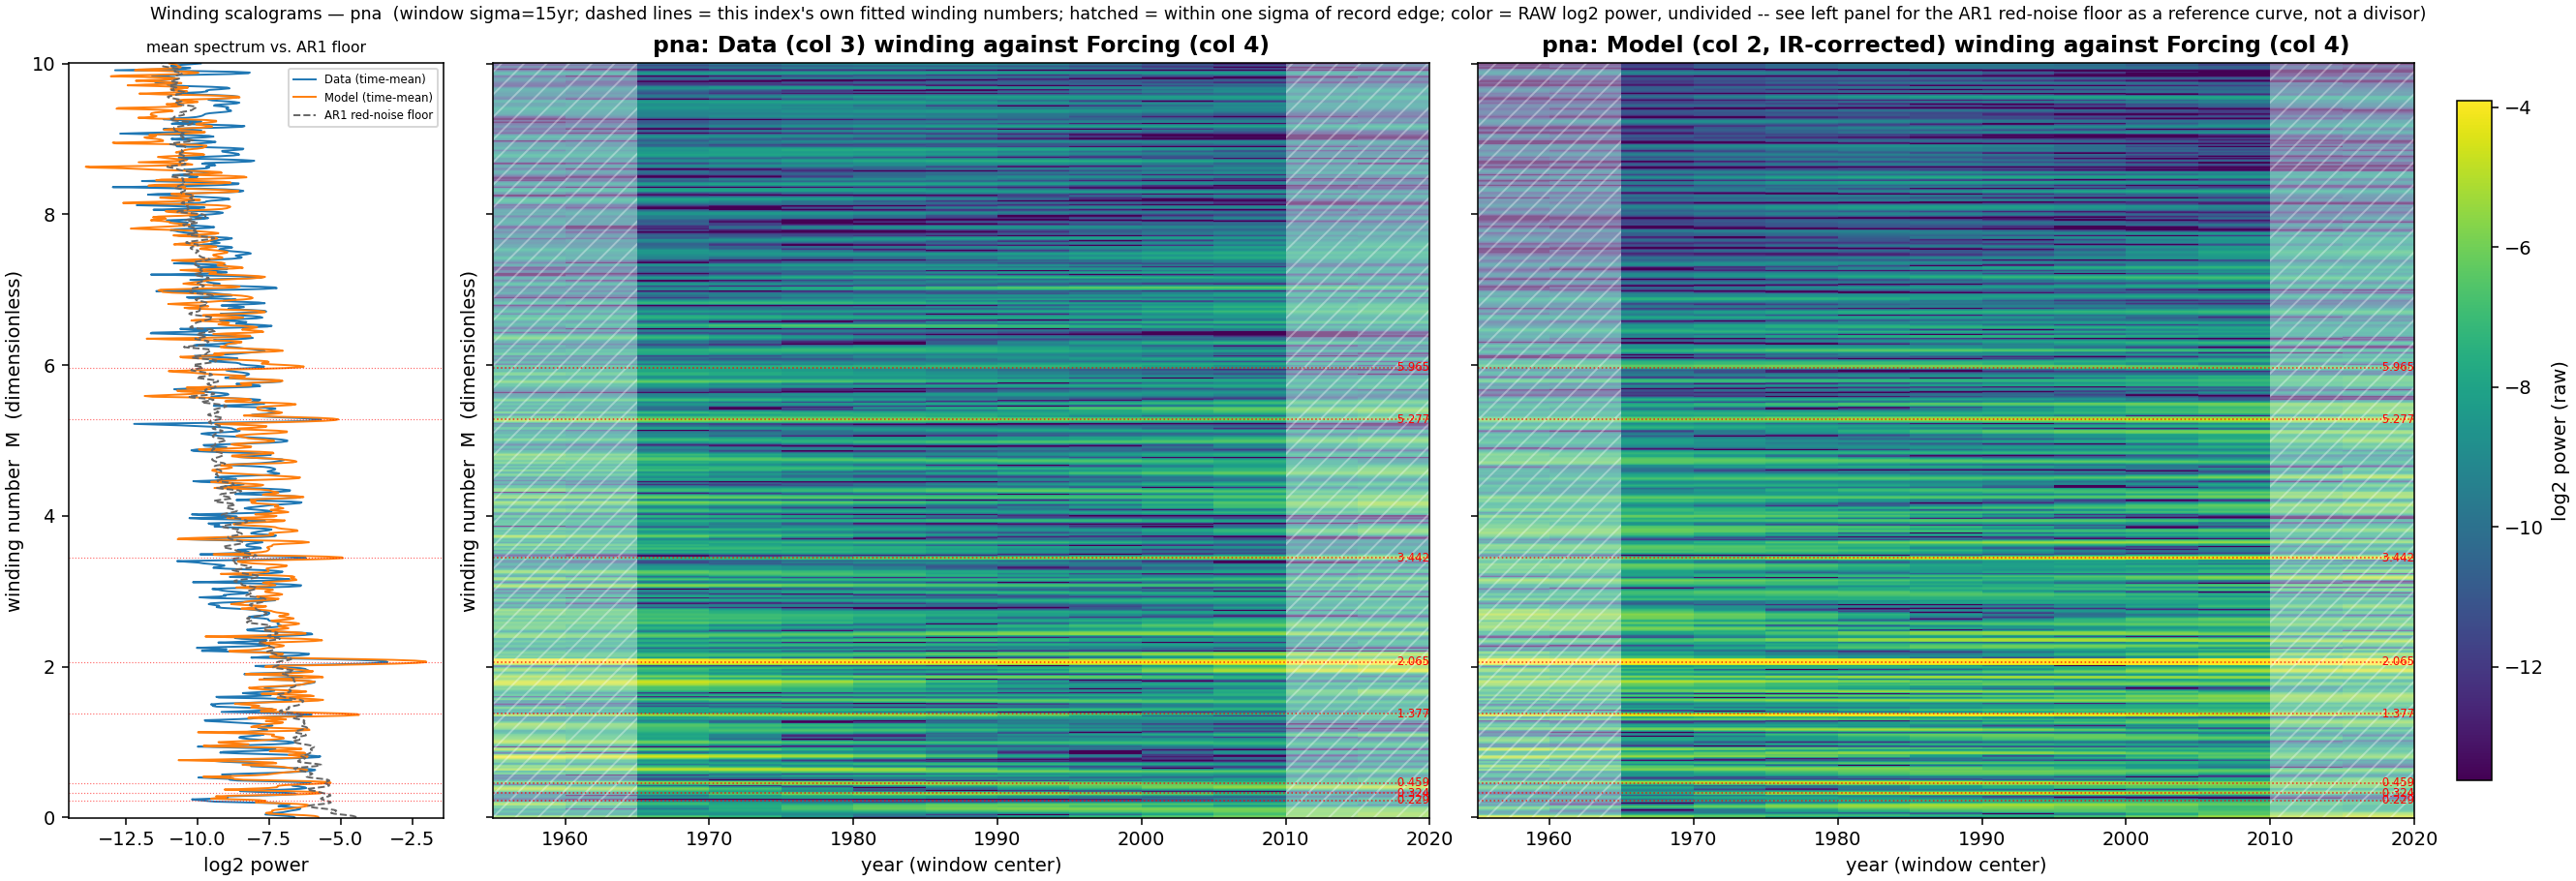
The other relationship to the PNA is that the strong winding in the SAM scalogram map is to the same 9×9\times harmonic using the same manifold (PNA winding scalogran here). That is the yellow line labeled (in red) 2.065 in the chart below. I am certain that the PNA and SAM time-series show no temporal correlation (double checked, see footnote1), so this winding is likely the common-mode basis between them, again strengthening the idea that the windings are global wavenumbers, perhaps related to the spherical harmonic expansion.

A comparative visualization showing two panels: the left panel displays winding scalograms with mean spectrum analysis over log2 power, while the right panel illustrates model data with IR-corrected winding against forcing over the same time period.

The time-series model fit is below. There is some overfitting in the test region but this is mainly time jitter

Time series analysis for Site sam with training and validation data shown in the top graph.

A companion test is to look at an SST region sensitive to tides near to the SAM annular region — the Patagonia Shelf quad:

World map highlighting the location kS040_W050 within the coordinates [-50..-30° latitude, -60..-40° longitude] marked by a red rectangle and a dot.

For the winding scalogram you can see the same yellow ridge at 2.07. Use the spectrum on the left to help locate it — a strong peak that extends right.

A wind scalogram displaying the relationship between log2 power and winding numbers over time, featuring three distinct plots: mean spectrum versus AR1 floor, actual data from k5040_W050, and a model comparison showing IR-corrected winding against forcing.

The CV test region is qualitatively better here as it tends to less time jitter on the peak and valley locations.

Time series analysis for site kS040_W050 showing variations over decades with data and model plots.

The Patagonia Shelf SST in fact does correlate with the SAM index. The correlation coefficient is 0.32 with the SST including a trend value.

Line graph displaying data correlation over time, with red line representing 'sample_results.csv' and blue line representing 'IS490_WB_Results.csv.' The x-axis denotes years, while the y-axis shows correlation values.

Footnotes

  1. Below is a time-series comparison between SAM and PNA, correlation essentially zero ↩︎
Line graph displaying Pearson correlation data over time, with blue and red lines representing two different datasets.

The Big 10 Climate Indices

The above diagram courtesy of Karnauskus

These correspond to the geographically defined climate indices

Overall I’m confident with the status of the published analysis of Laplace’s Tidal Equations in Mathematical Geoenergy, as I can model each of these climate indices with precisely the same (save one ***) tidal forcing, all calibrated by LOD. The following Threads allow interested people to contribute thoughts

  1. ENSO – https://www.threads.net/@paulpukite/post/CuWS8MFu8Jc
  2. AMO – https://www.threads.net/@paulpukite/post/Cuh4krjJTLN
  3. PDO – https://www.threads.net/@paulpukite/post/Cuu0VCypIi5
  4. QBO – https://www.threads.net/@paulpukite/post/CuiKQ5tsXCQ
  5. SOI (Darwin & Tahiti) – https://www.threads.net/@paulpukite/post/Cuu2IkBJh55 => MJO
  6. IOD (East & West) – https://www.threads.net/@paulpukite/post/Cuu9PYvJAG2
  7. PNA – https://www.threads.net/@paulpukite/post/CuvAVR7JN7R
  8. AO – https://www.threads.net/@paulpukite/post/CuvEz37JPFV
  9. SAM – https://www.threads.net/@paulpukite/post/CuvLZ2CMt1X
  10. NAO – https://www.threads.net/@paulpukite/post/CuvNnwns2la

(*** The odd-one out is QBO, which is a global longitudinally-invariant behavior, which means that only a couple of tidal factors are important.)

Is the utility of this LTE modeling a groundbreaking achievement? => https://www.threads.net/@paulpukite/post/CuvNnwns2la

AO, PNA, & SAM Models

In Chapter 11, we developed a general formulation based on Laplace’s Tidal Equations (LTE) to aid in the analysis of standing wave climate models, focusing on the ENSO and QBO behaviors in the book.  As a means of cross-validating this formulation, it makes sense to test the LTE model against other climate indices. So far we have extended this to PDO, AMO, NAO, and IOD, and to complete the set, in this post we will evaluate the northern latitude indices comprised of the Arctic Oscillation/Northern Annular Mode (AO/NAM) and the Pacific North America (PNA) pattern, and the southern latitude index referred to as the Southern Annular Mode (SAM). We will first evaluate AO and PNA in comparison to its close relative NAO and then SAM …

Continue reading →