With the correct intermediate manifold, those of AMO and PDO are nearly indistinguishable. The ocean response is subtle — AMO has the basin-wide slow response, whereas PDO doesn’t, and both have a similar LTE modulation as shown in the middle-right panel below.
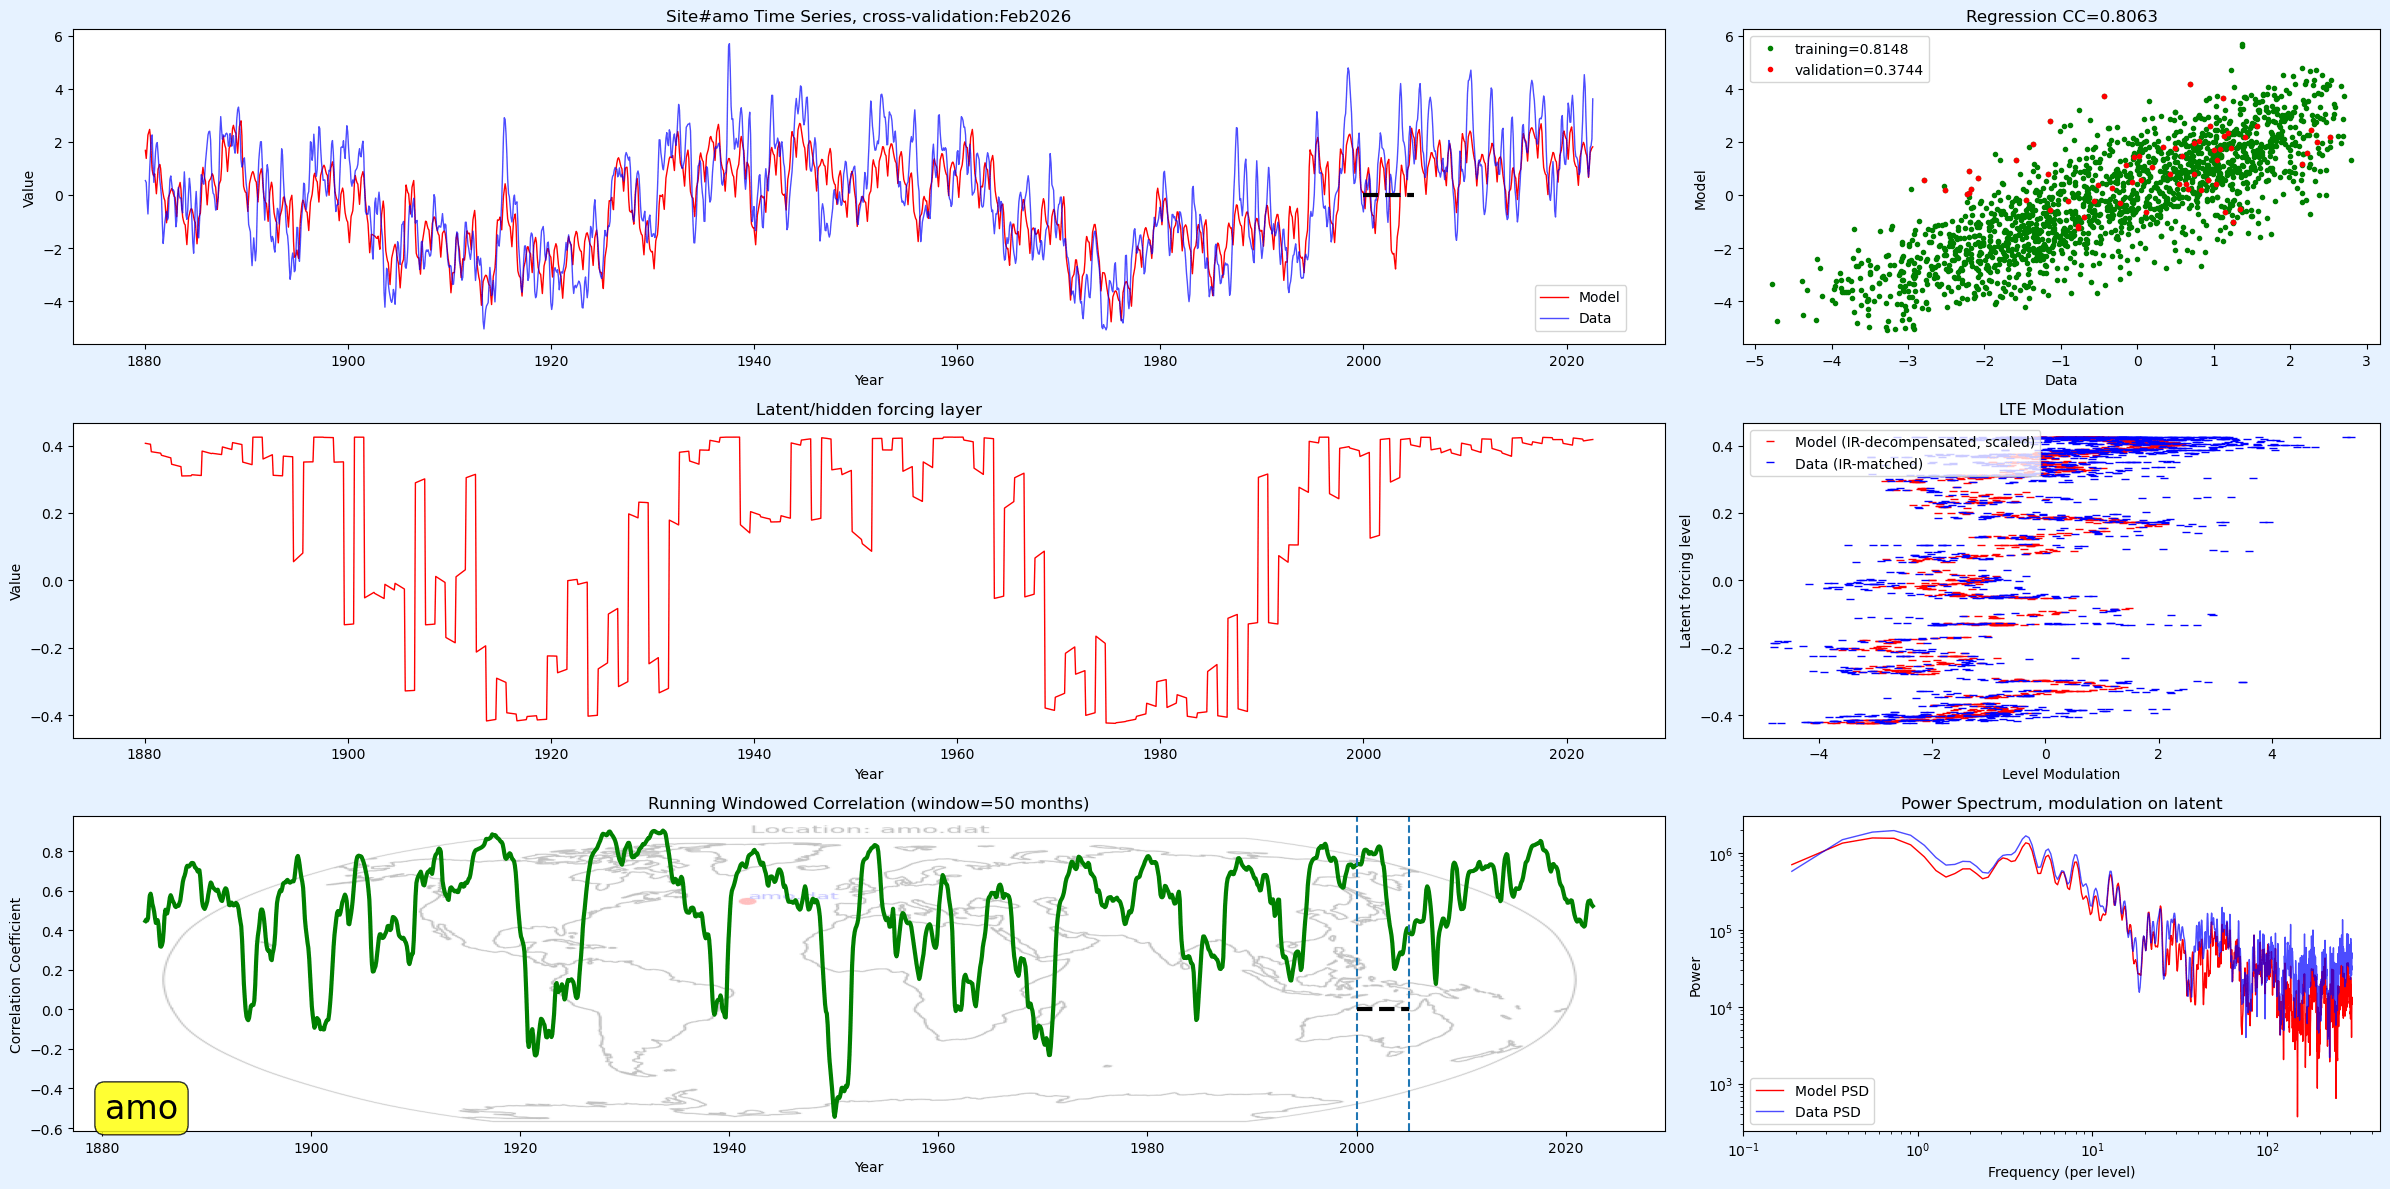
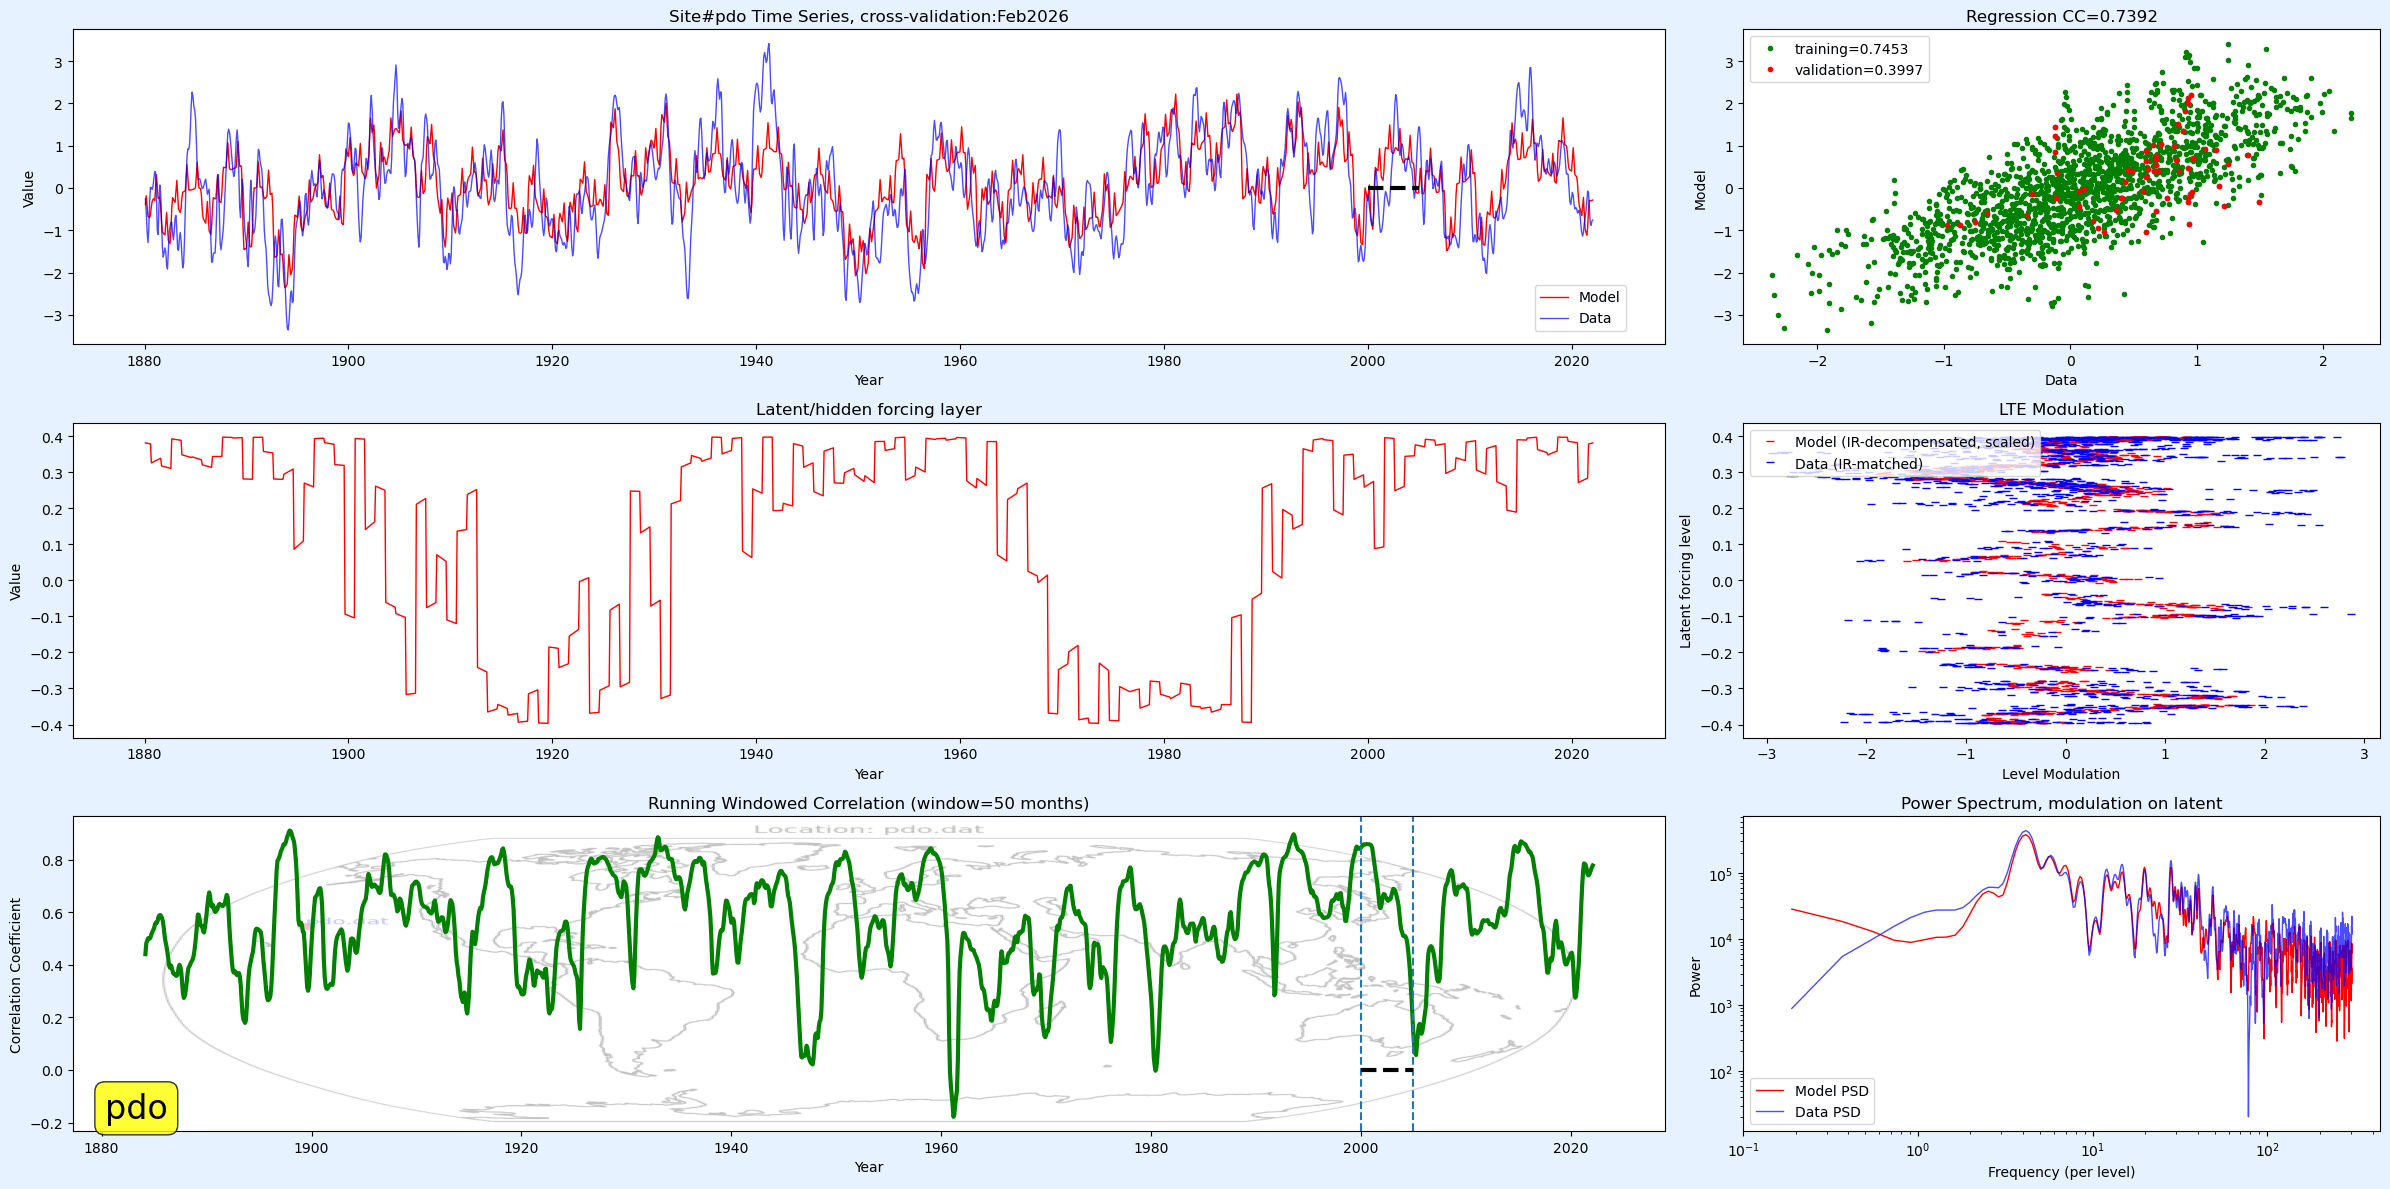
This is not a teleconnection but a common-mode forcing manifold each with a distinct response.
https://github.com/pukpr/gem-lte-core – experiments/Feb2026
All the quads in the global SST grid follow from these two as seeded values and with NINO4, which seems to have more of a split winding character than PDO – see experiments/Oct2026_layer_ir
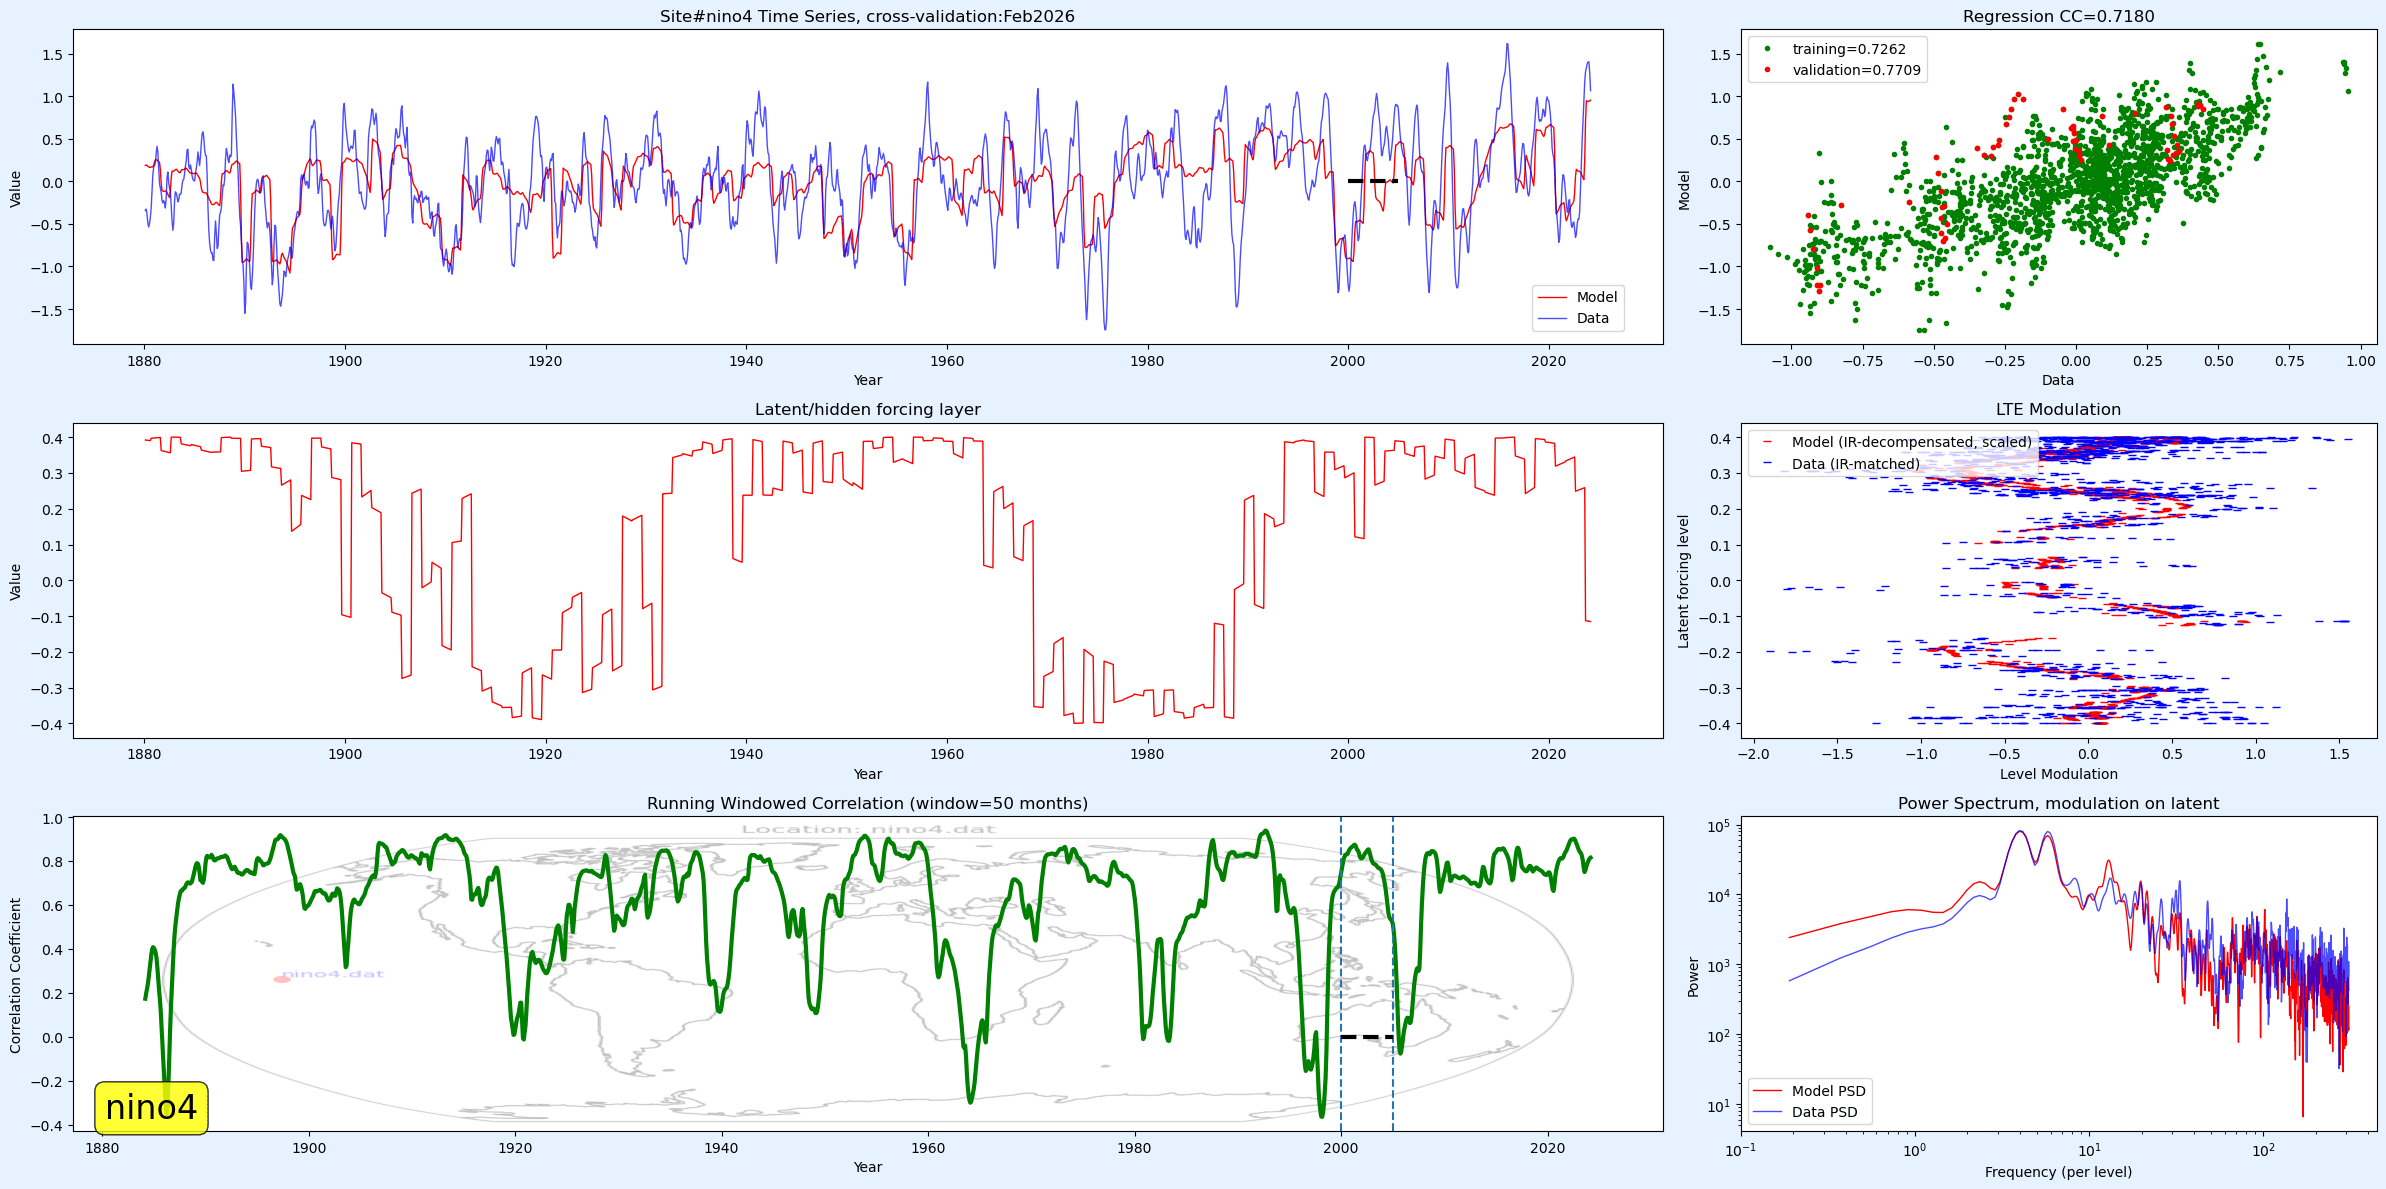
The essential fitting equation is the following, where is the integrated annual impulse response to the calibrated LOD tidal forcing1. The term is a spherical fitted sinusoidal phase correction. The winding is small and represents the basin friction layer. For AMO, the sum is essentially a single winding and with ENSO, a second winding emerges so .
Model =
where
This cascaded sinusoidal modulation is not complex nor computational-intensive in comparison to a GCM
And an empirical neural network representation, which features an analogous set of convolutional layers, would be impossible to reverse engineer.
Global SST
The variations observed in global SST are largely accounted for by the ENSO, AMO, and PDO indices. A linear trend, corresponding to AGW, is needed to model global SST below, of which the model is a composite of all the modeled quads in the Kaplan extend SST V2.

References
- P. Pukite, D. Challou, and D.Coyne, Mathematical Geoenergy, (Wiley, 2018), https://agupubs.onlinelibrary.wiley.com/doi/book/10.1002/9781119434351 ↩︎ ↩︎