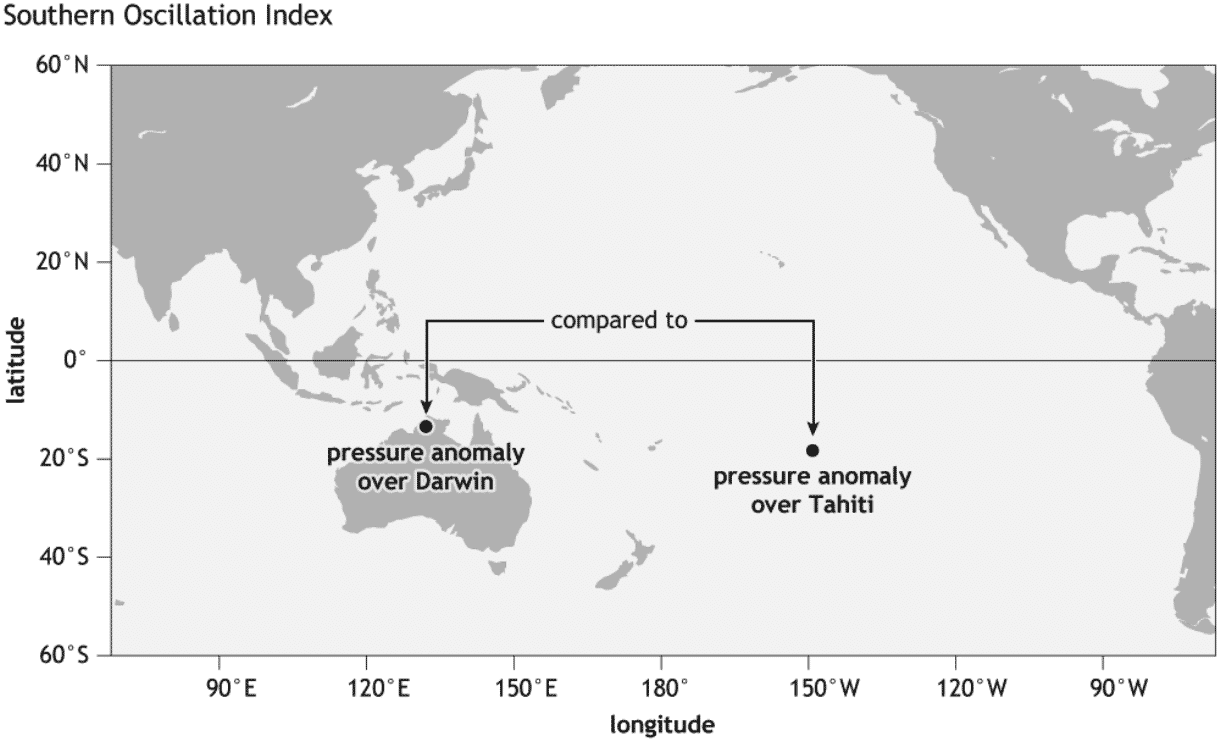
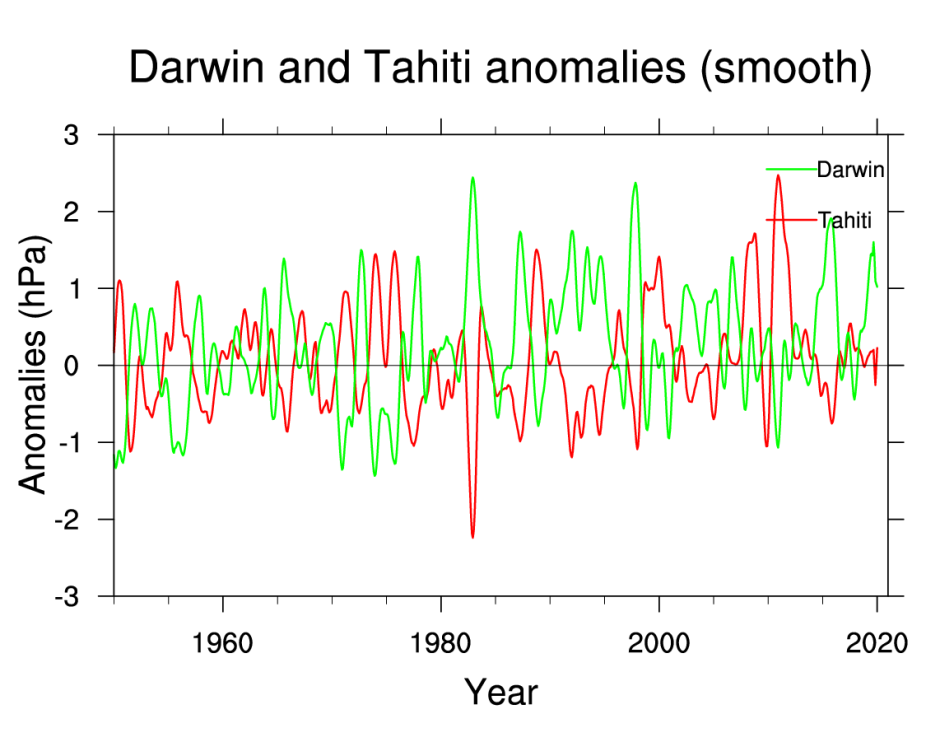
It turns out that the Darwin location of the Southern Oscillation Index (SOI) dipole is brilliantly easy to behaviorally model on it’s own.

The input forcing is calibrated to the differential length-of-day (LOD) with a correlation coefficient of 0.9997, and only a few terms are required to capture the standing-wave modes corresponding to the ENSO dipole.
So which curve below is the time-series data of atmospheric pressure at Darwin and which is the Laplace’s Tidal Equation (LTE) model calibrated from dLOD measurements?
- (bottom, red) = ?
- (top, blue) = ??

As a bonus, the couple of years outside of the training interval are extrapolated from the model. This shouldn’t be hard for climate scientists, …. or is it still too difficult?
If that isn’t enough to discriminate between the two, the power spectra of the LTE mapping to model and to data is shown below. This identifies a couple of the lower frequency modulations as strong peaks and a few weaker higher harmonic peaks that sharpen the model’s detail. This shows that the data’s behavior possesses a high amount of order not apparent in the time series.

Poll on Twitter =>
Why isn’t the Tahiti time-series included since that would provide additional signal discrimination via a differential measurement as one should be the complement of the other? It should accentuate the signal and remove noise (and any common-mode behavior) if the Darwin and Tahiti are perfect anti-nodes for all standing-wave modes. However, it appears that only the main ENSO standing-wave mode is balanced in all modes.

In that case, the Darwin set alone works well. Mastodon