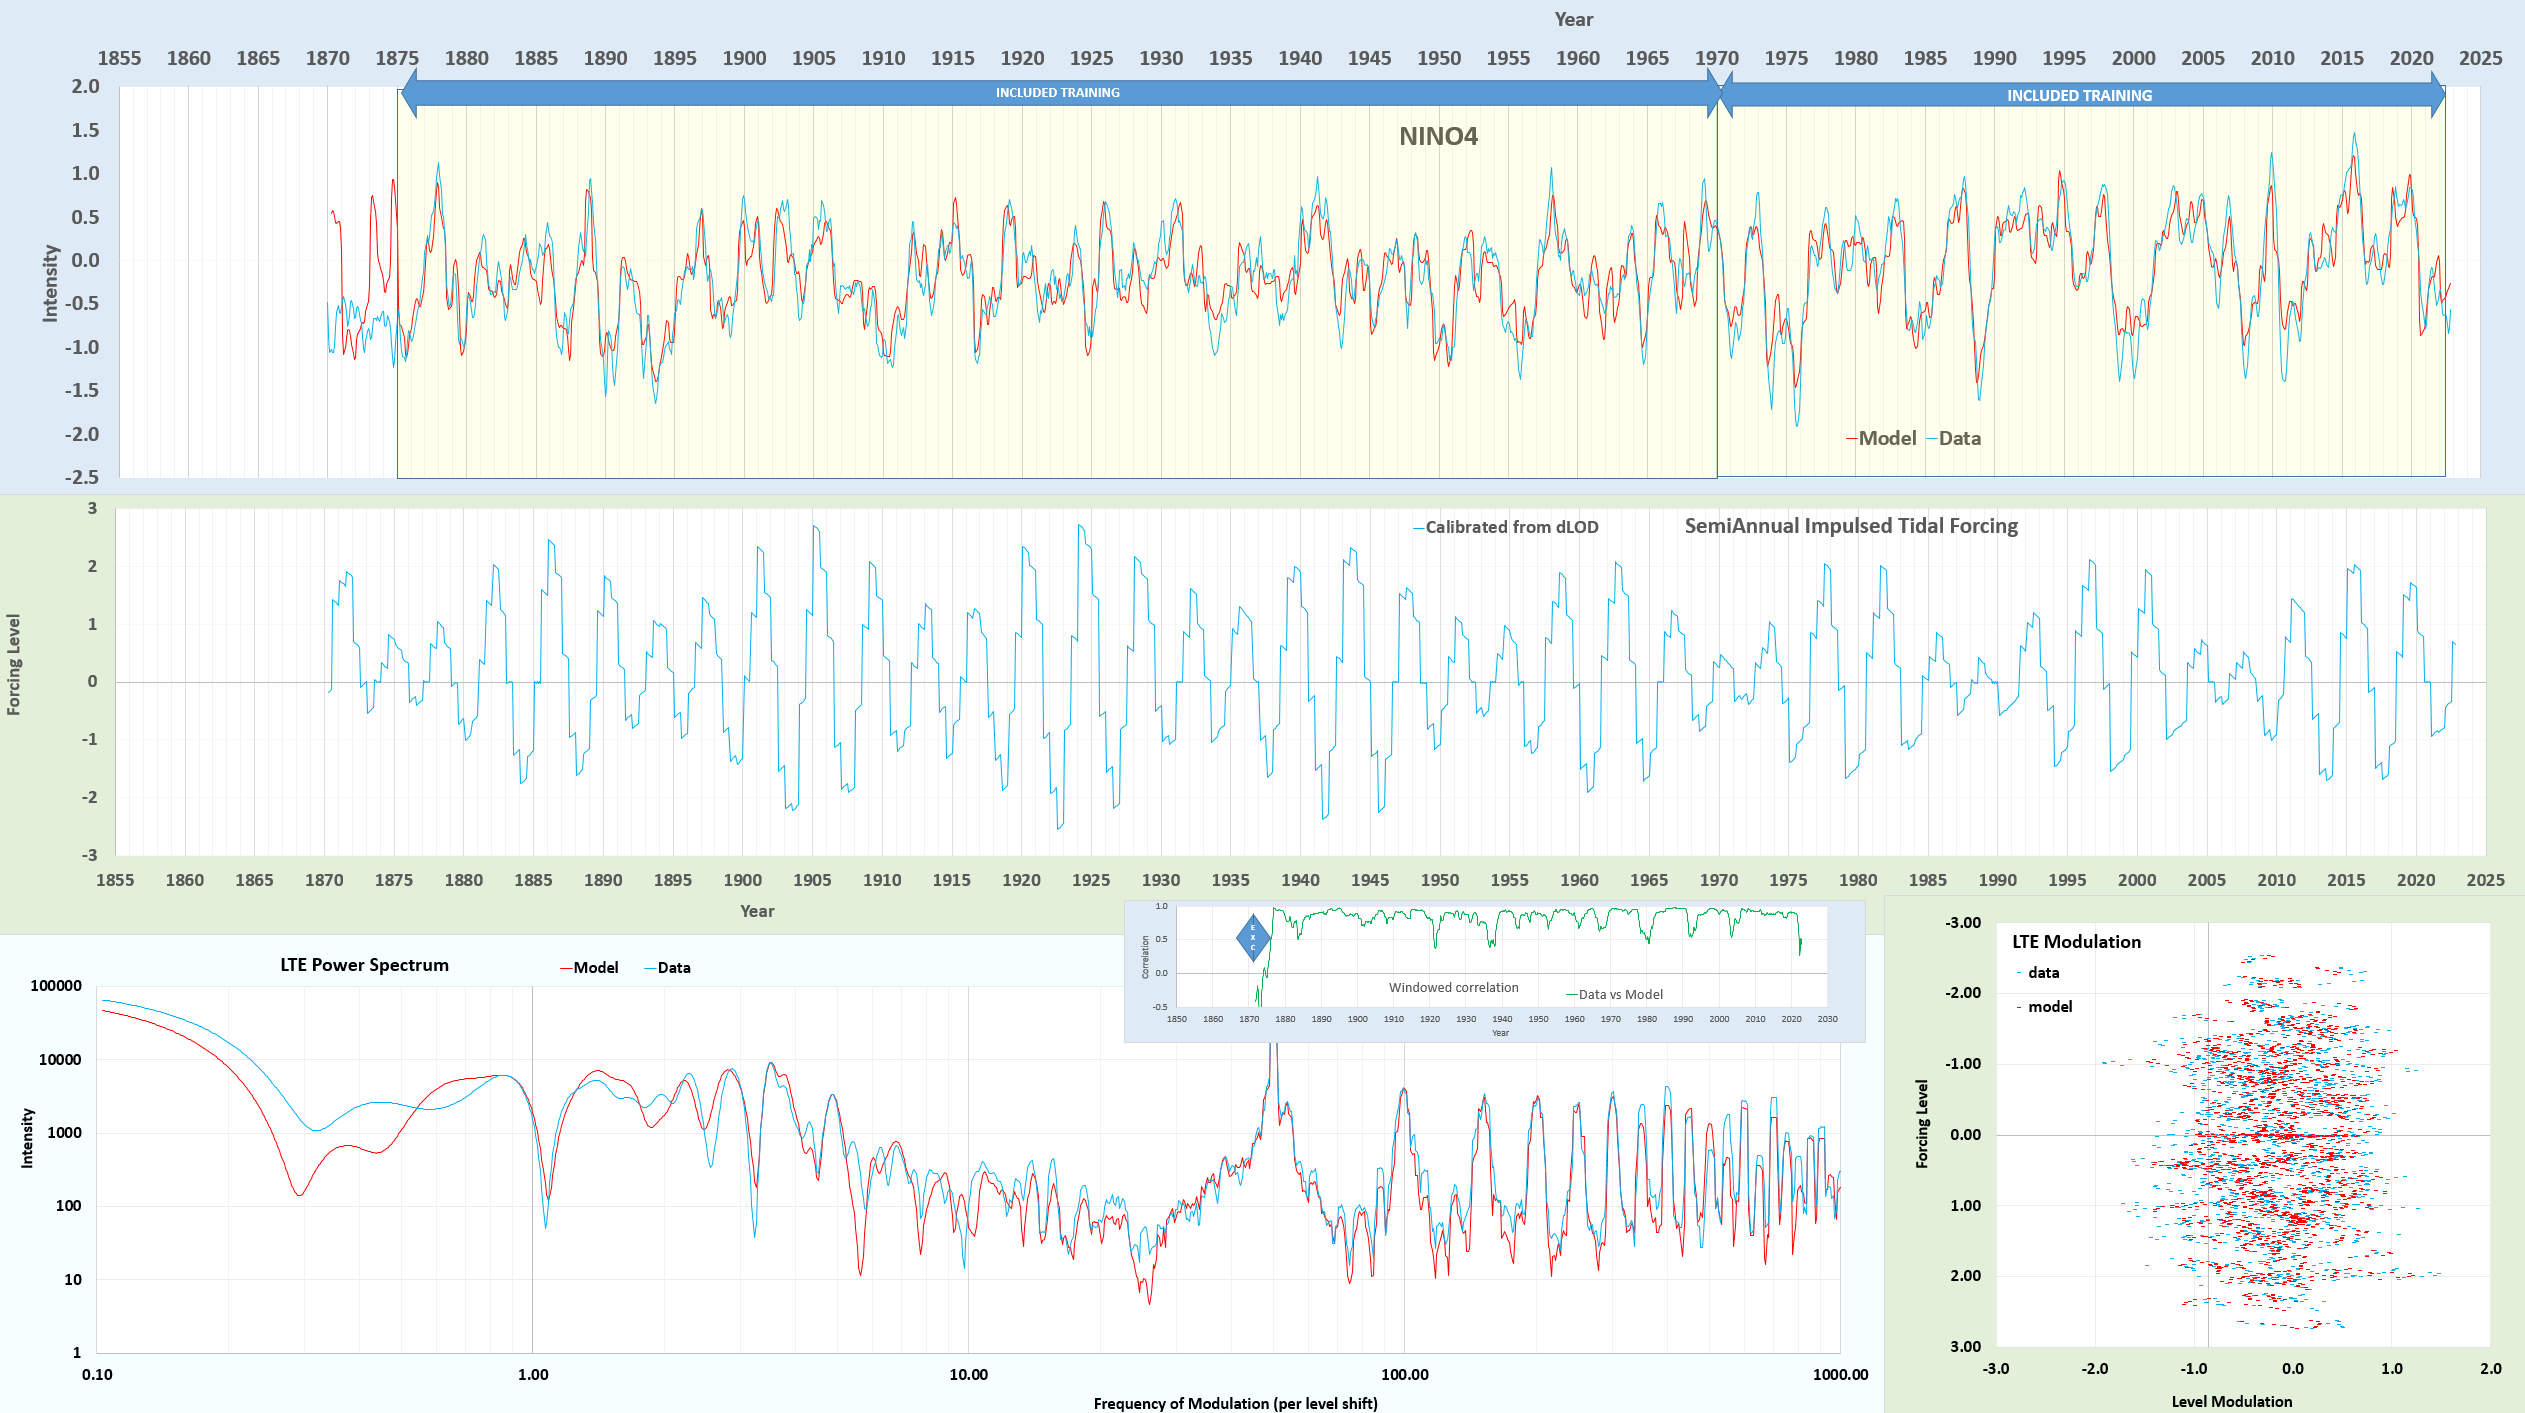
Using the LTE model on the NINO4 ENSO time-series, I excluded the interval between 1870-1875 for cross-validation. The fit below is from scratch on a dLOD-calibrated initial forcing, then allowing the values to vary slightly but the dLOD remains at 0.9999668 of the initial calibration.

The cross-validation doesn’t look good and actually is anti-correlated to a CC = -0.5 over that interval. But the region before 1875 appears suspiciously flat in any case, see the data on the KNMI site — it’s only a certainty that the El Nino peak at 1877-1878 is real and not estimated.
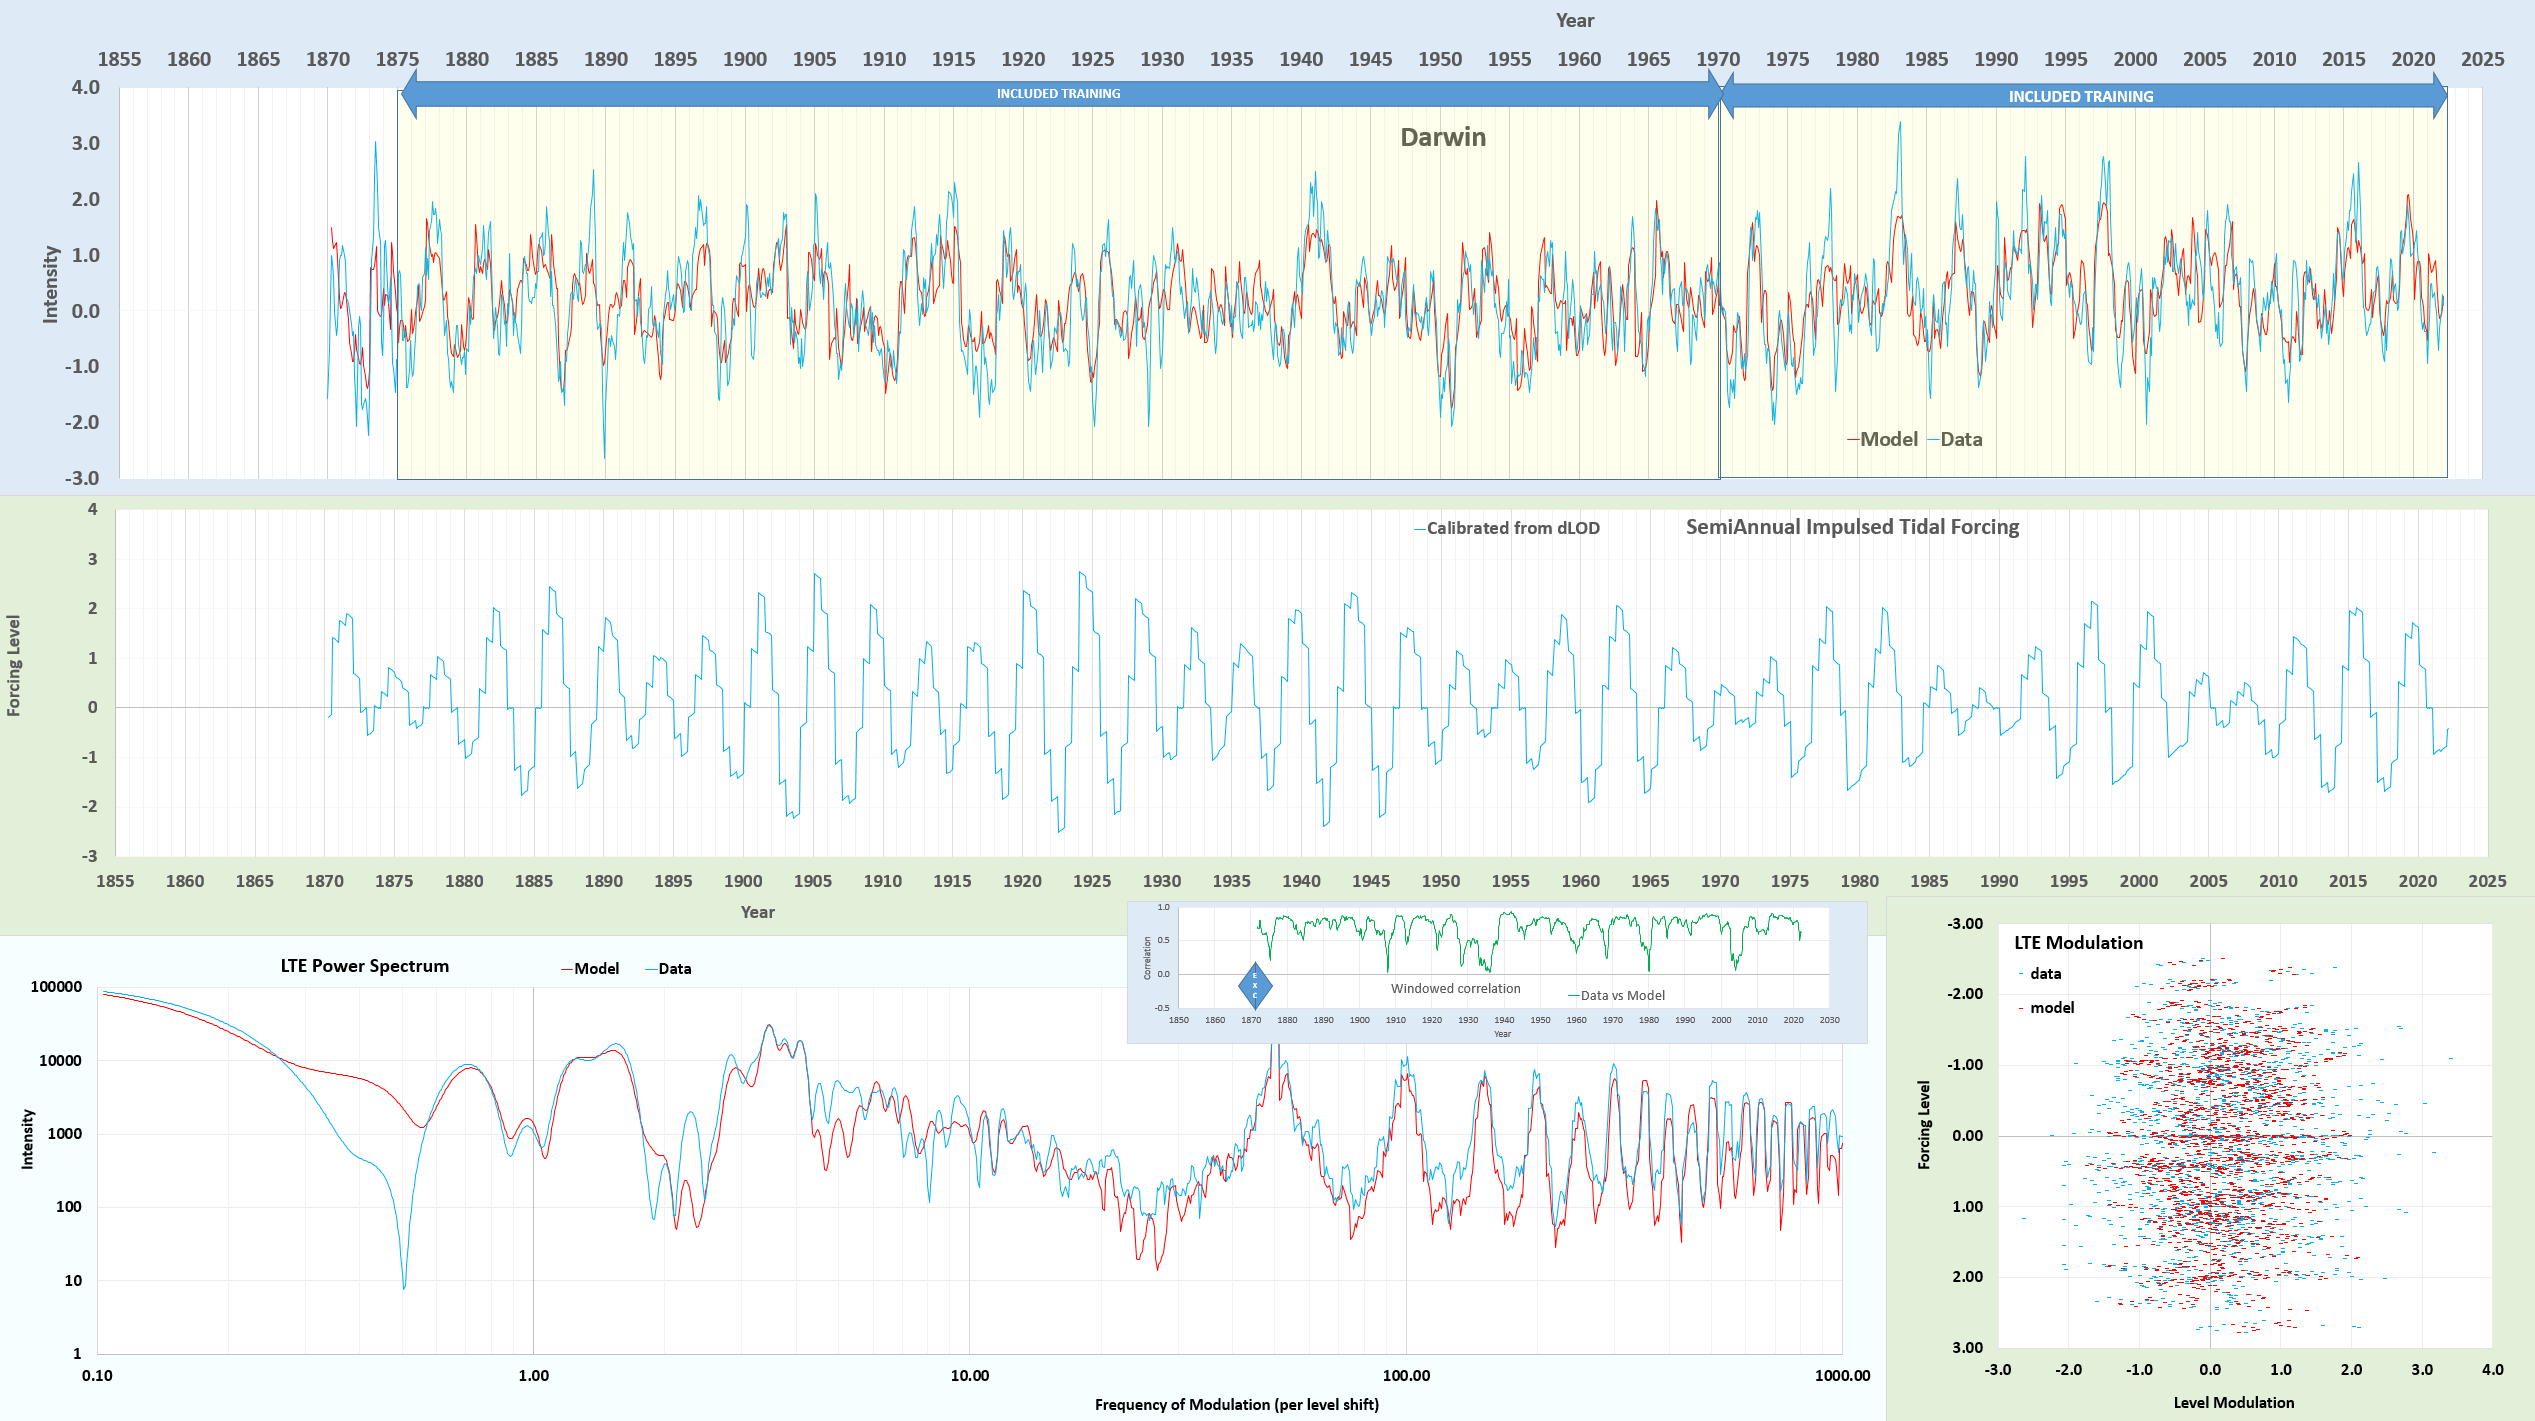
So, the next step is to take the fit to NINO4 and apply it to the Darwin (SOI) time-series, applying the same fitting interval from 1875-present. Immediately, it captures the 3 positive excursions in the interval 1870 to 1875. And then letting the fit proceed to a high CC, the result is shown below:

The resultant fit in the excluded cross-validation region reaches 0.58, thus reversing the anti-correlation and confirming that the NINO4 time-series data prior to 1875 is likely incorrect.
The fit data is at https://gist.github.com/pukpr/c26f1da00337e92dbb47671ca48af2cf?permalink_comment_id=4639783#gistcomment-4639783. The main modifications to tidal factors are in the very long periods — these values start small due to the dLOD calibration (the differential filters out low frequencies) but the 4.42 year amplitude is nearly tripled after the fit, the 8.85 & 9.3 year up by 50%. The 18.6 year is only up 14%, and the 3rd order 6 year and 15.9 year are down 63% and up 45% respectively. All the fortnightly and monthly values are stable. This is perhaps reasonable considering how much the LOD drifts over time at low frequency, and that the calibration is restricted to post-1962.
