Teleconnections vs Common-mode mechanisms

The term teleconnection has long been defined as interactions between behaviors separated by geographical distances. Using Google Scholar, the first consistent use in a climate context was by De Geer in the 1920’s [1]. He astutely contrasted the term teleconnection with telecorrelation, with the implication being that the latter describes a situation where two behaviors are simply correlated through some common-mode mechanism — in the case that De Geer describes, the self-registration of the annual solar signal with respect to two geographically displaced sedimentation features.

As an alternate analogy, the hibernation of groundhogs and black bears isn’t due to some teleconnection between the two species but simply a correlation due to the onset of winter. The timing of cold weather is the common-mode mechanism that connects the two behaviors. This may seem obvious enough that the annual cycle should and often does serve as the null hypothesis for ascertaining correlations of climate data against behavioral models.

Yet, this distinction seems to have been lost over the years, as one will often find papers hypothesizing that one climate behavior is influencing another geographically distant behavior via a physical teleconnection (see e.g. [2]). This has become an increasingly trendy viewpoint since the GWPF advisor A.A. Tsonis added the term network to indicate that behaviors may contain linkages between multiple nodes, and that the seeming complexity of individual behavior is only discovered by decoding the individual teleconnections [3].

That’s acceptable as a theory, but in practice, it’s still important to consider the possible common-mode mechanisms that may be involved. In this post we will look at a possible common-mode mechanisms between the atmospheric behavior of QBO (see Chapter 11 in the book) and the oceanic behavior of ENSO (see Chapter 12). As reference [3] suggests, this may be a physical teleconnection, but the following analysis shows how a common-mode forcing may be much more likely.

Continue reading
Detailed Forcing of QBO

In Chapter 11 of the book, we present the geophysical recipe for the forcing of the QBO of equatorial stratospheric winds. As explained, the fundamental forcing is supplied by the lunar draconic cycle and impulse modulated by a semi-annual (equatorial) nodal crossing of the sun. It’s clear that the QBO cycle has asymptotically approached a value of 2.368 years, which is explained by its near perfect equivalence to the physically aliased draconic period. Moreover, there is also strong evidence that the modulation/fluctuation of the QBO period from cycle to cycle is due to the regular variation in the lunar inclination, thus impacting the precise timing and shape of the draconic sinusoid. That modulation is described in this post.

Continue reading

Characterizing spatial standing waves of ENSO

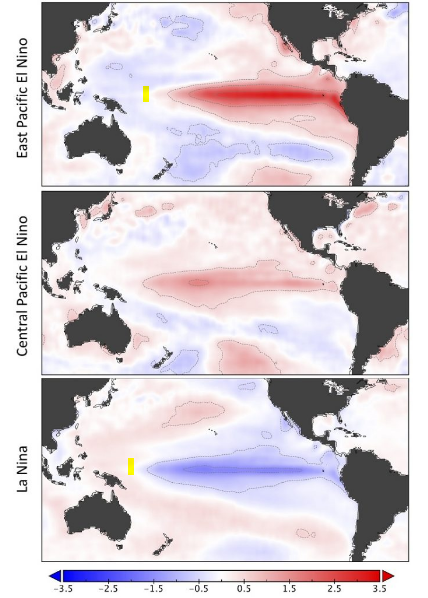
In Chapter 12 of the book, we did not delve into the details of the spatial aspects of the LTE-based ENSO standing wave model to any great degree. We did include a concise derivation of the steps involved in creating separable equations, corresponding to solutions for the temporal and spatial parts of the standing wave dipole. However, only passing mention was made of the unique nature of the spatio-temporal coordination which emerges from the model — and which should be observed in the empirically observed behavior. We can do that now with the abundance of comprehensive data available.

Figure 1: The challenge is to capture the spatial profile of the ENSO standing wave dipole — the El Nino to La Nina oscillation, with the dipole node location indicated by the yellow bar (site)
Continue reading

Applying Wavelet Scalograms

Dennis suggested:

“I was thinking about ENSO model and the impulse function used to drive it.  Could it be the wind shift from the QBO that is related to that impulse function.

My recollection was that it was a biennial pulse, which timing wise might fit with QBO. “

5/19/2019

They are somehow related but more than likely through a common-mode mechanism. Consider that QBO has elements of a semi-annual impulse, as the sun crosses the equator twice per year.  The ENSO model has an impulse of once per year, with more recent evidence that it may not have to be biennial (i.e. alternating sign in consecutive years) as we described it in the book.

I had an evaluation Mathematica license for a few weeks so ran several wavelet scalograms on the data and models. Figure 1 below is a comparison of ENSO to the model

Continue reading

Synchronization, critical points, and relaxation oscillators

In Chapter 18 of the book, we discuss the behavior around critical points in the context of reliability, both at the small-scale in terms of component breakdown, and in the large-scale in the context of earthquake triggering which was introduced in Chapter 13. The connection is that things break at all scales, with the common mechanism of a varying rate of progression to the critical point:

2uu0cu

As indicated in the figure caption, the failure rate is generally probabilistic but with known external forcings, there is the potential for a better deterministic prediction of the breakdown point, which is reviewed below:

Continue reading

Forced Natural Responses to LTE Solution

In Chapter 12 of the book, we describe in detail the solution to Laplace’s Tidal Equations (LTE), which were introduced in Chapter 11.  Like the solution to the linear wave equation, where there are even (cosine) and odd (sine) natural responses, there are also  even and odd responses for nonlinear wave equations such as the Mathieu equation, where the natural response solutions are identified as MathieuC and MathieuS.  So we find that in general the mix of even and odd solutions for any modeled problem is governed by the initial conditions of the behavior along with any continuing forcing. We will describe how that applies to the LTE system next:

Continue reading

Implicit Interpolating Cross-Validation of ENSO

In Chapter 12 of the book, we describe the forcing mechanism behind the El Nino / Southern Oscillation (ENSO) behavior and here we continue to evaluate the rich dynamic behavior of the Southern Oscillation Index (SOI) — the pressure dipole measure of ENSO. In the following, we explore how the low-fidelity version of the SOI can reveal the high-frequency content via the solution to Laplace’s Tidal Equations.

Continue reading