Based on the previous post on applying Dynamic Time Warping as a metric for LTE modeling of oceanic indices, it makes sense to apply the metric to the QBO model of atmospheric winds. A characteristic of QBO data is the sharp transitions of wind reversals. As described previously, DTW allows a fit to adjust the alignment between model and data without incurring a potential over-fitting penalty that a conventional correlation coefficient will often lead to.
Continue readingClimate
Full Wave Forcing
MSet
Global Models of Sea Surface Temperature
These are a set of 6 EOFs that describe the global SST in terms of a set of orthogonal time-series — essentially non-overlapping, each having a cross-correlation of ~0.0 with the others, like a sine/cosine pair, but in both spatial and temporal dimensions.
Continue readingThe Power of Darwin (part 2)
Continuation of the model described in part 1.
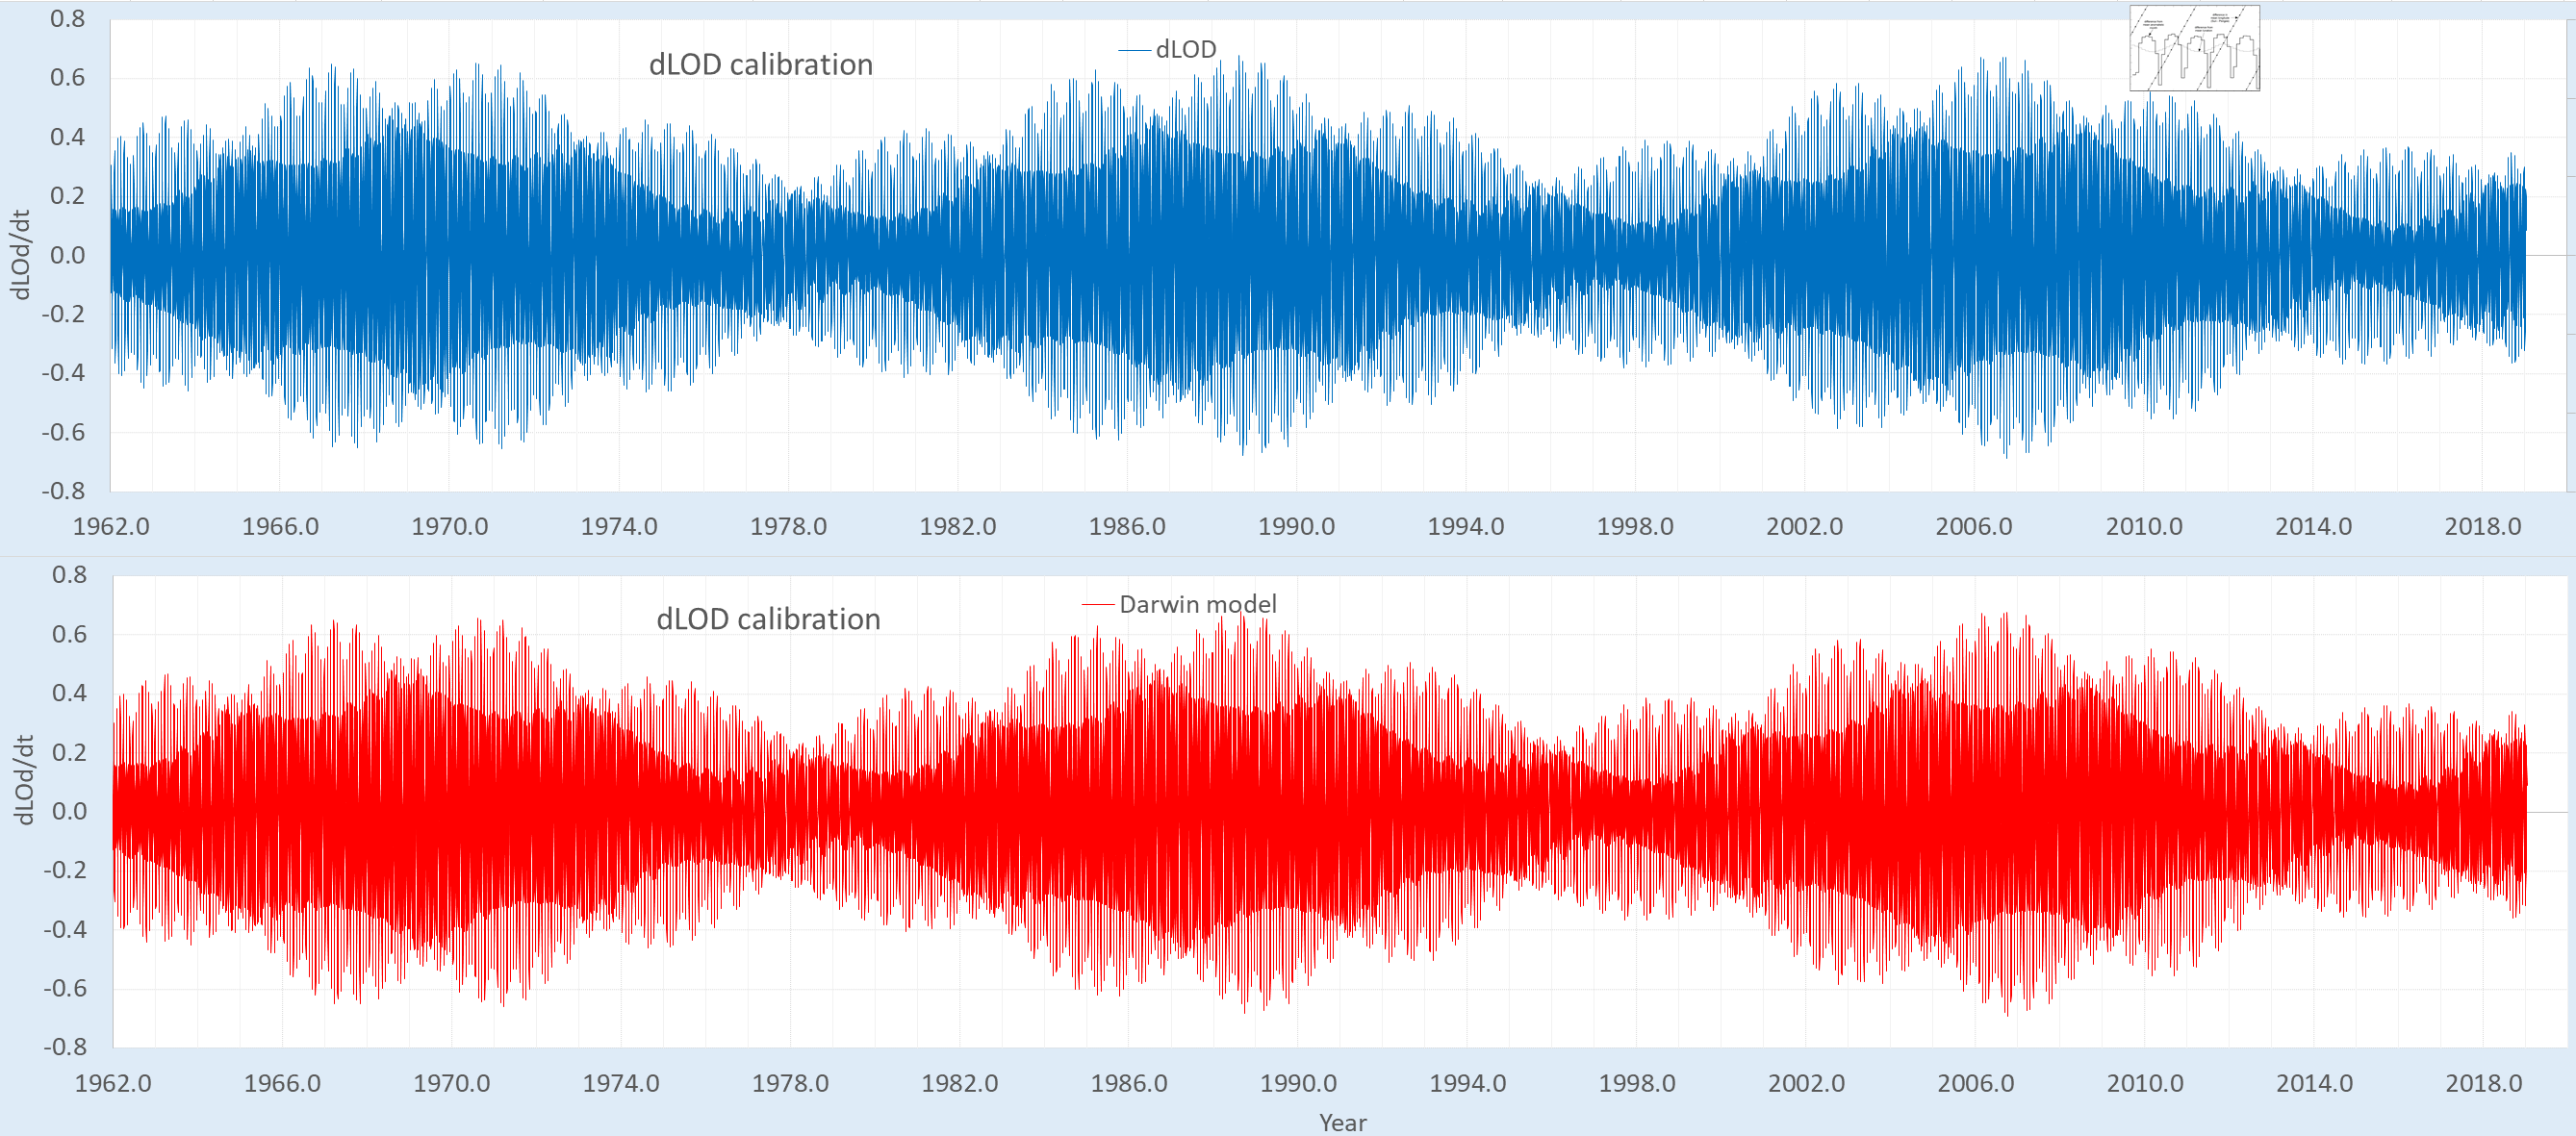
The cross-validation described earlier was rather limited. Here an attempt is made to fit to an interval of the Darwin time-series and see how well it matches to a longer out-of-band validation interval. Very few degrees of freedom are involved in this procedure as the selection of tidal factors is constrained by a simultaneous LOD calibration. The variation from this reference is slight, correlation remaining around 0.999 to the LOD cal, but necessary to apply as the ENSO model appears highly structurally sensitive to coherence of the tidal signal over the 150 year time span of the data to be modeled.
A typical LOD calibration (click on image to enlarge)
Cross-validation shown in the top panel below, based on an training time interval ranging from the start of the Darwin data collection in 1870 up to 1980. The middle panel is the forcing input, from which the non-linear Laplace’s Tidal Equation (LTE) modulation is applied to a semi-annual impulse integration of the tidal signal. The procedure is straightforward — whatever modulation is applied to the training interval to optimize the fit, the same modulation is applied blindly to the excluded validation interval.
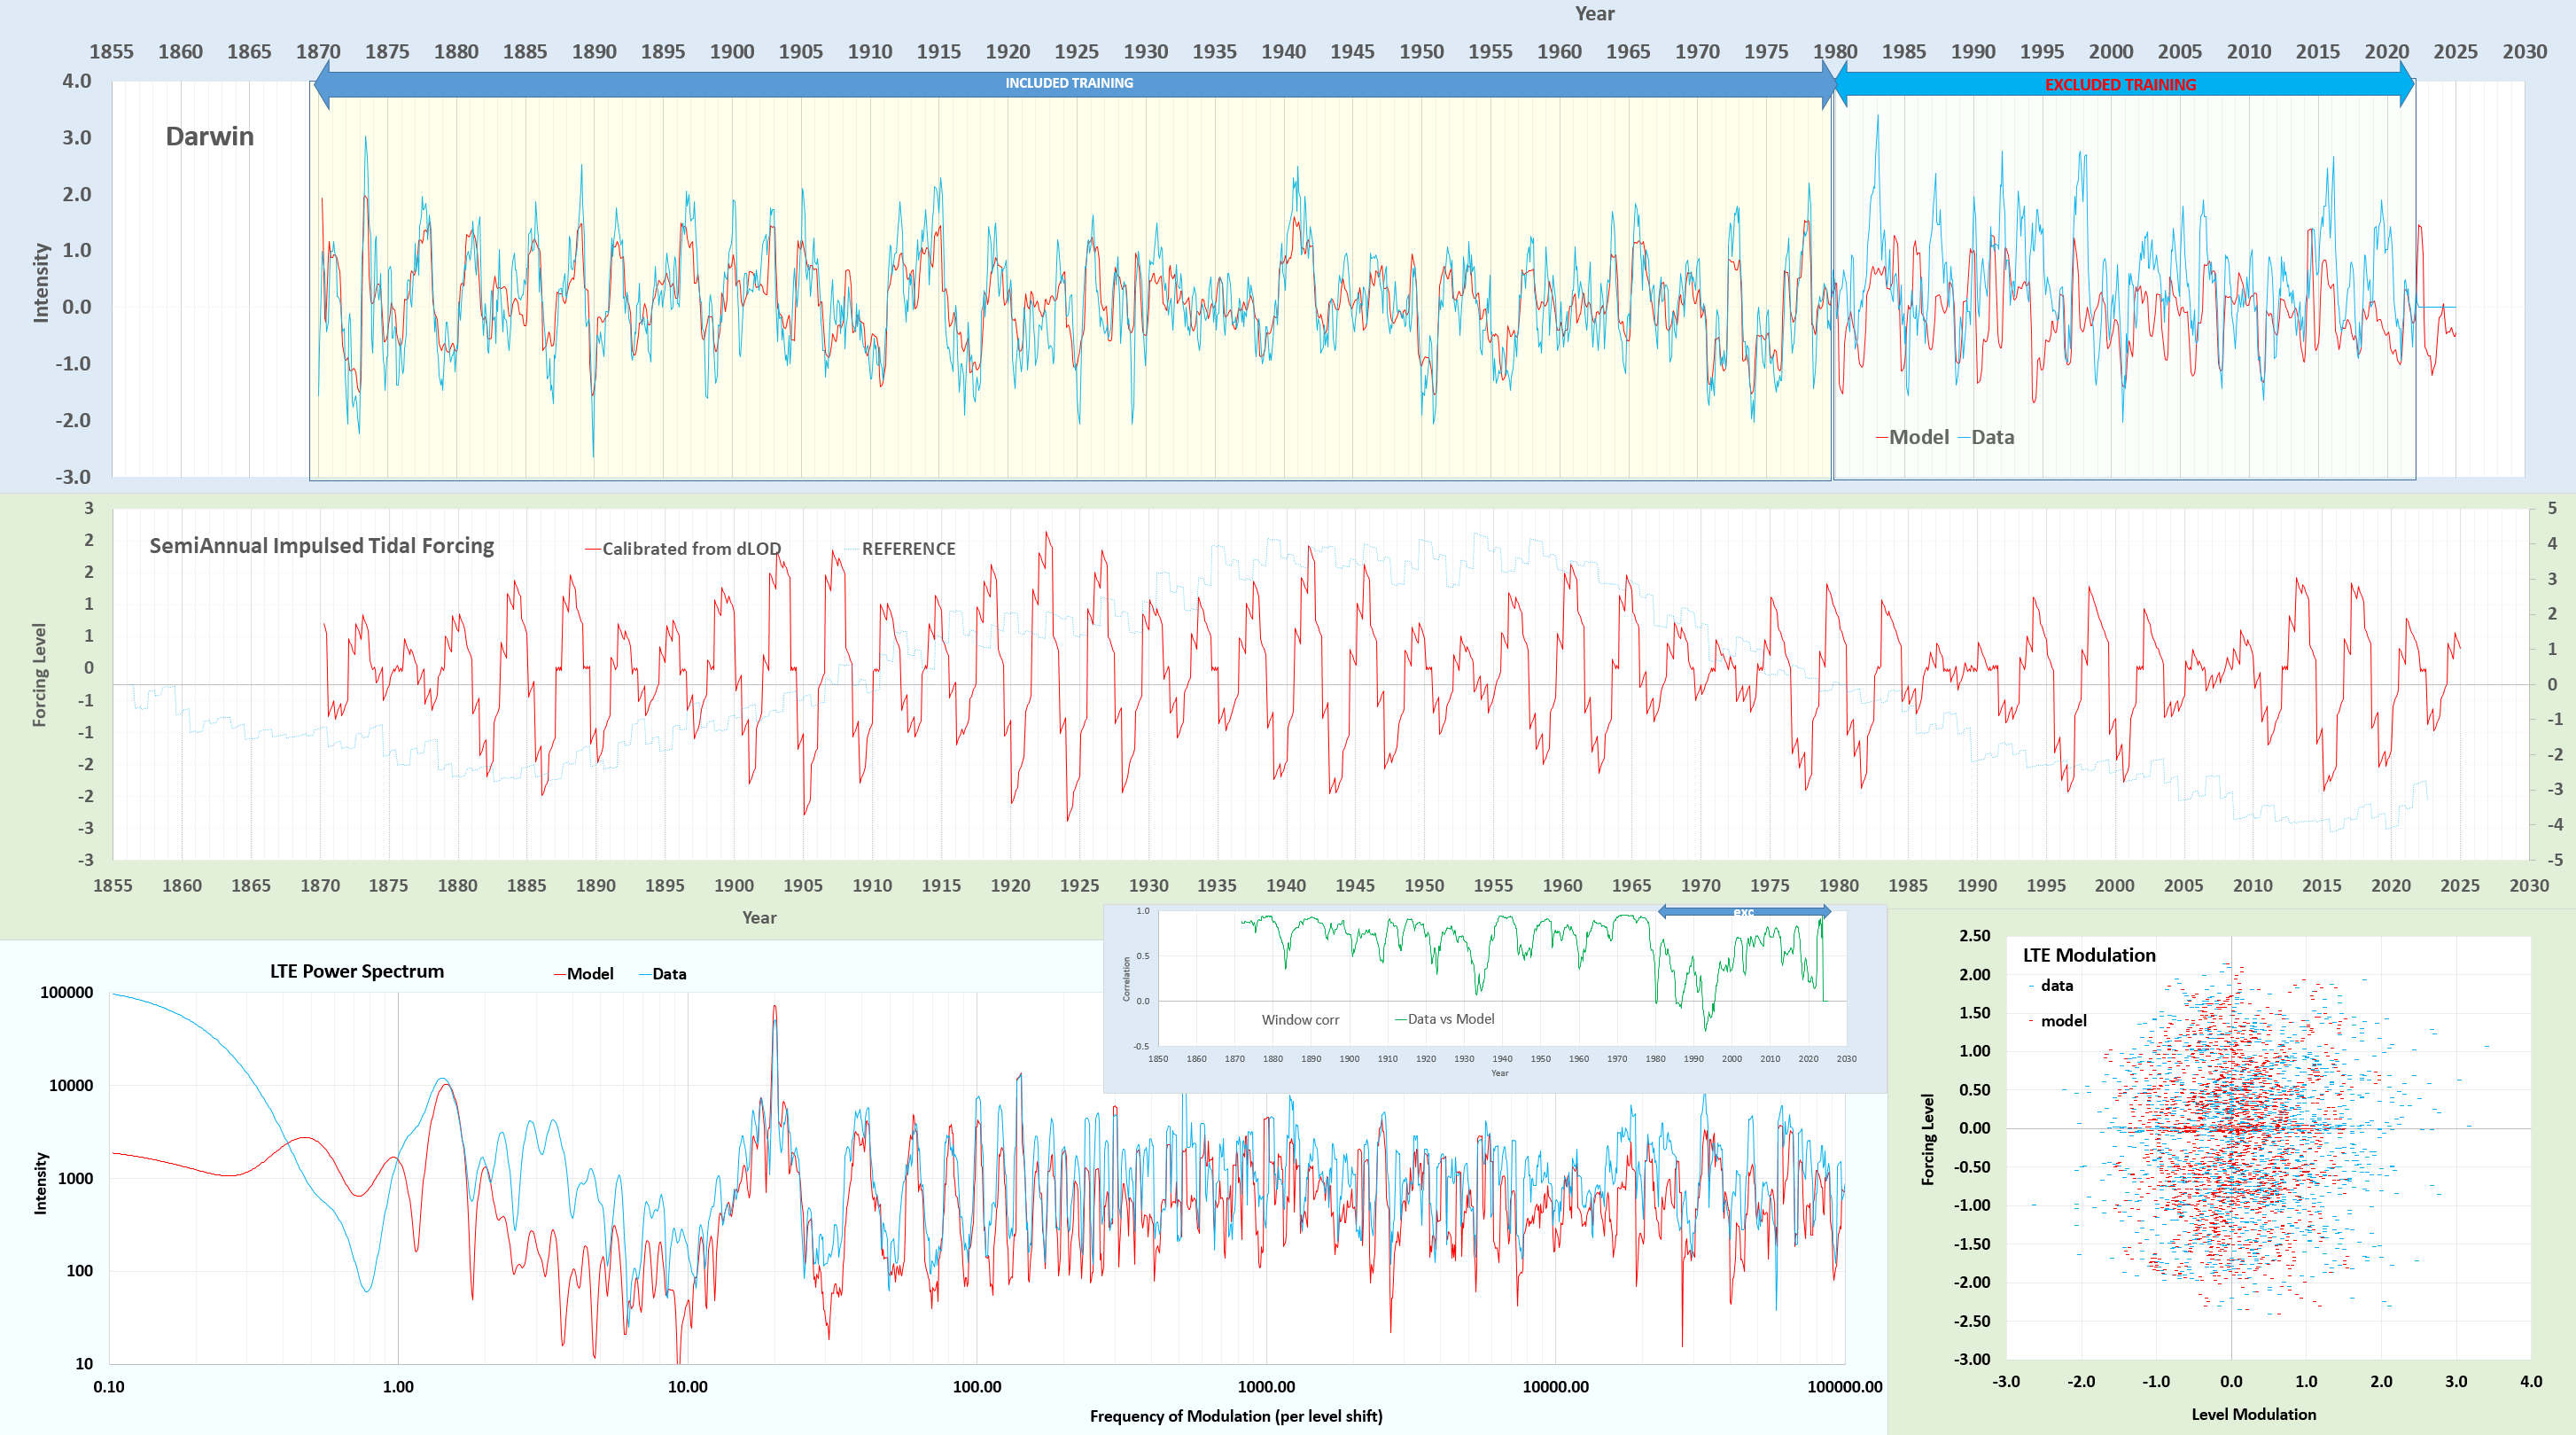
The validation on the 1980+ out-of-band interval is far from perfect, yet well-beyond being highly significant. The primary sinusoidal modulation is nominally set to the reciprocal of the slope (r) of top-edge of the sawtooth forcing [1] — this fundamental and the harmonics of that modulation satisfy LTE and provide a mechanism for a semi-annual level shift.
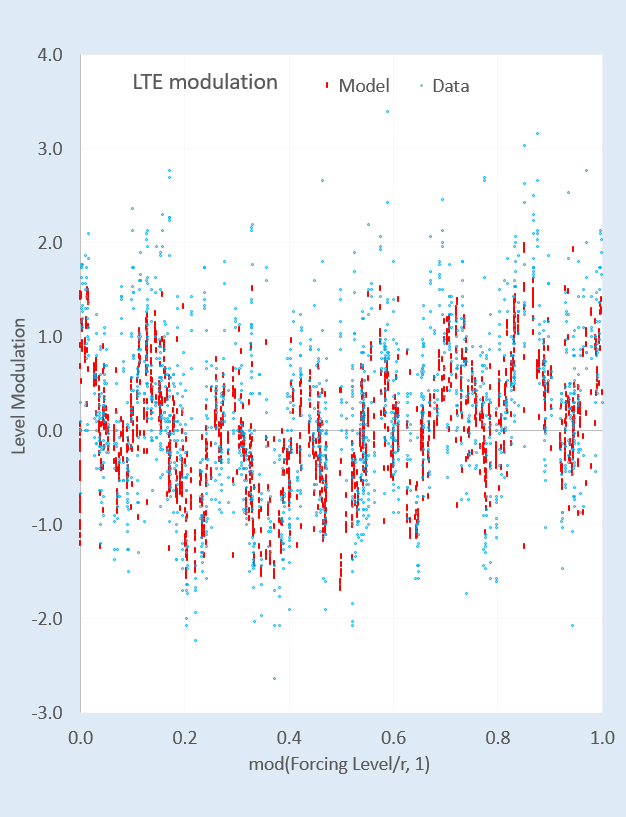
The plotted lower right modulation appears as noise, but when demodulated as in modulo r, the periodic order is revealed as shown below:
The harmonic modulations above include close to a monthly rate, a clear ~4.5 day, and and underlying fast semi-durnal ( 365.25/(12 x 61) = 0.499)
  LTE Modulation    Amplitude        Phase   Harmonic
   3.95901009601, 0.10819059771,  2.56829482810 0  -- slow LTE modulation
   1.34461504256, 0.12014470401,  0.28639994030 0  -- slow LTE modulation
 -20.01129999289, 0.11320535624,  2.58186128147 1  -- monthly fundamental
-140.07909995021, 0.49935565041,  2.12022069445 7  -- strong 4.5 day
-1220.6892995660, 0.95817753106, -2.88519906135 61 -- strong semi-diurnal
The significance of the cross-validation can be further substantiated by taking the complement of the training interval as the new training interval. This does converge to a stationary solution.
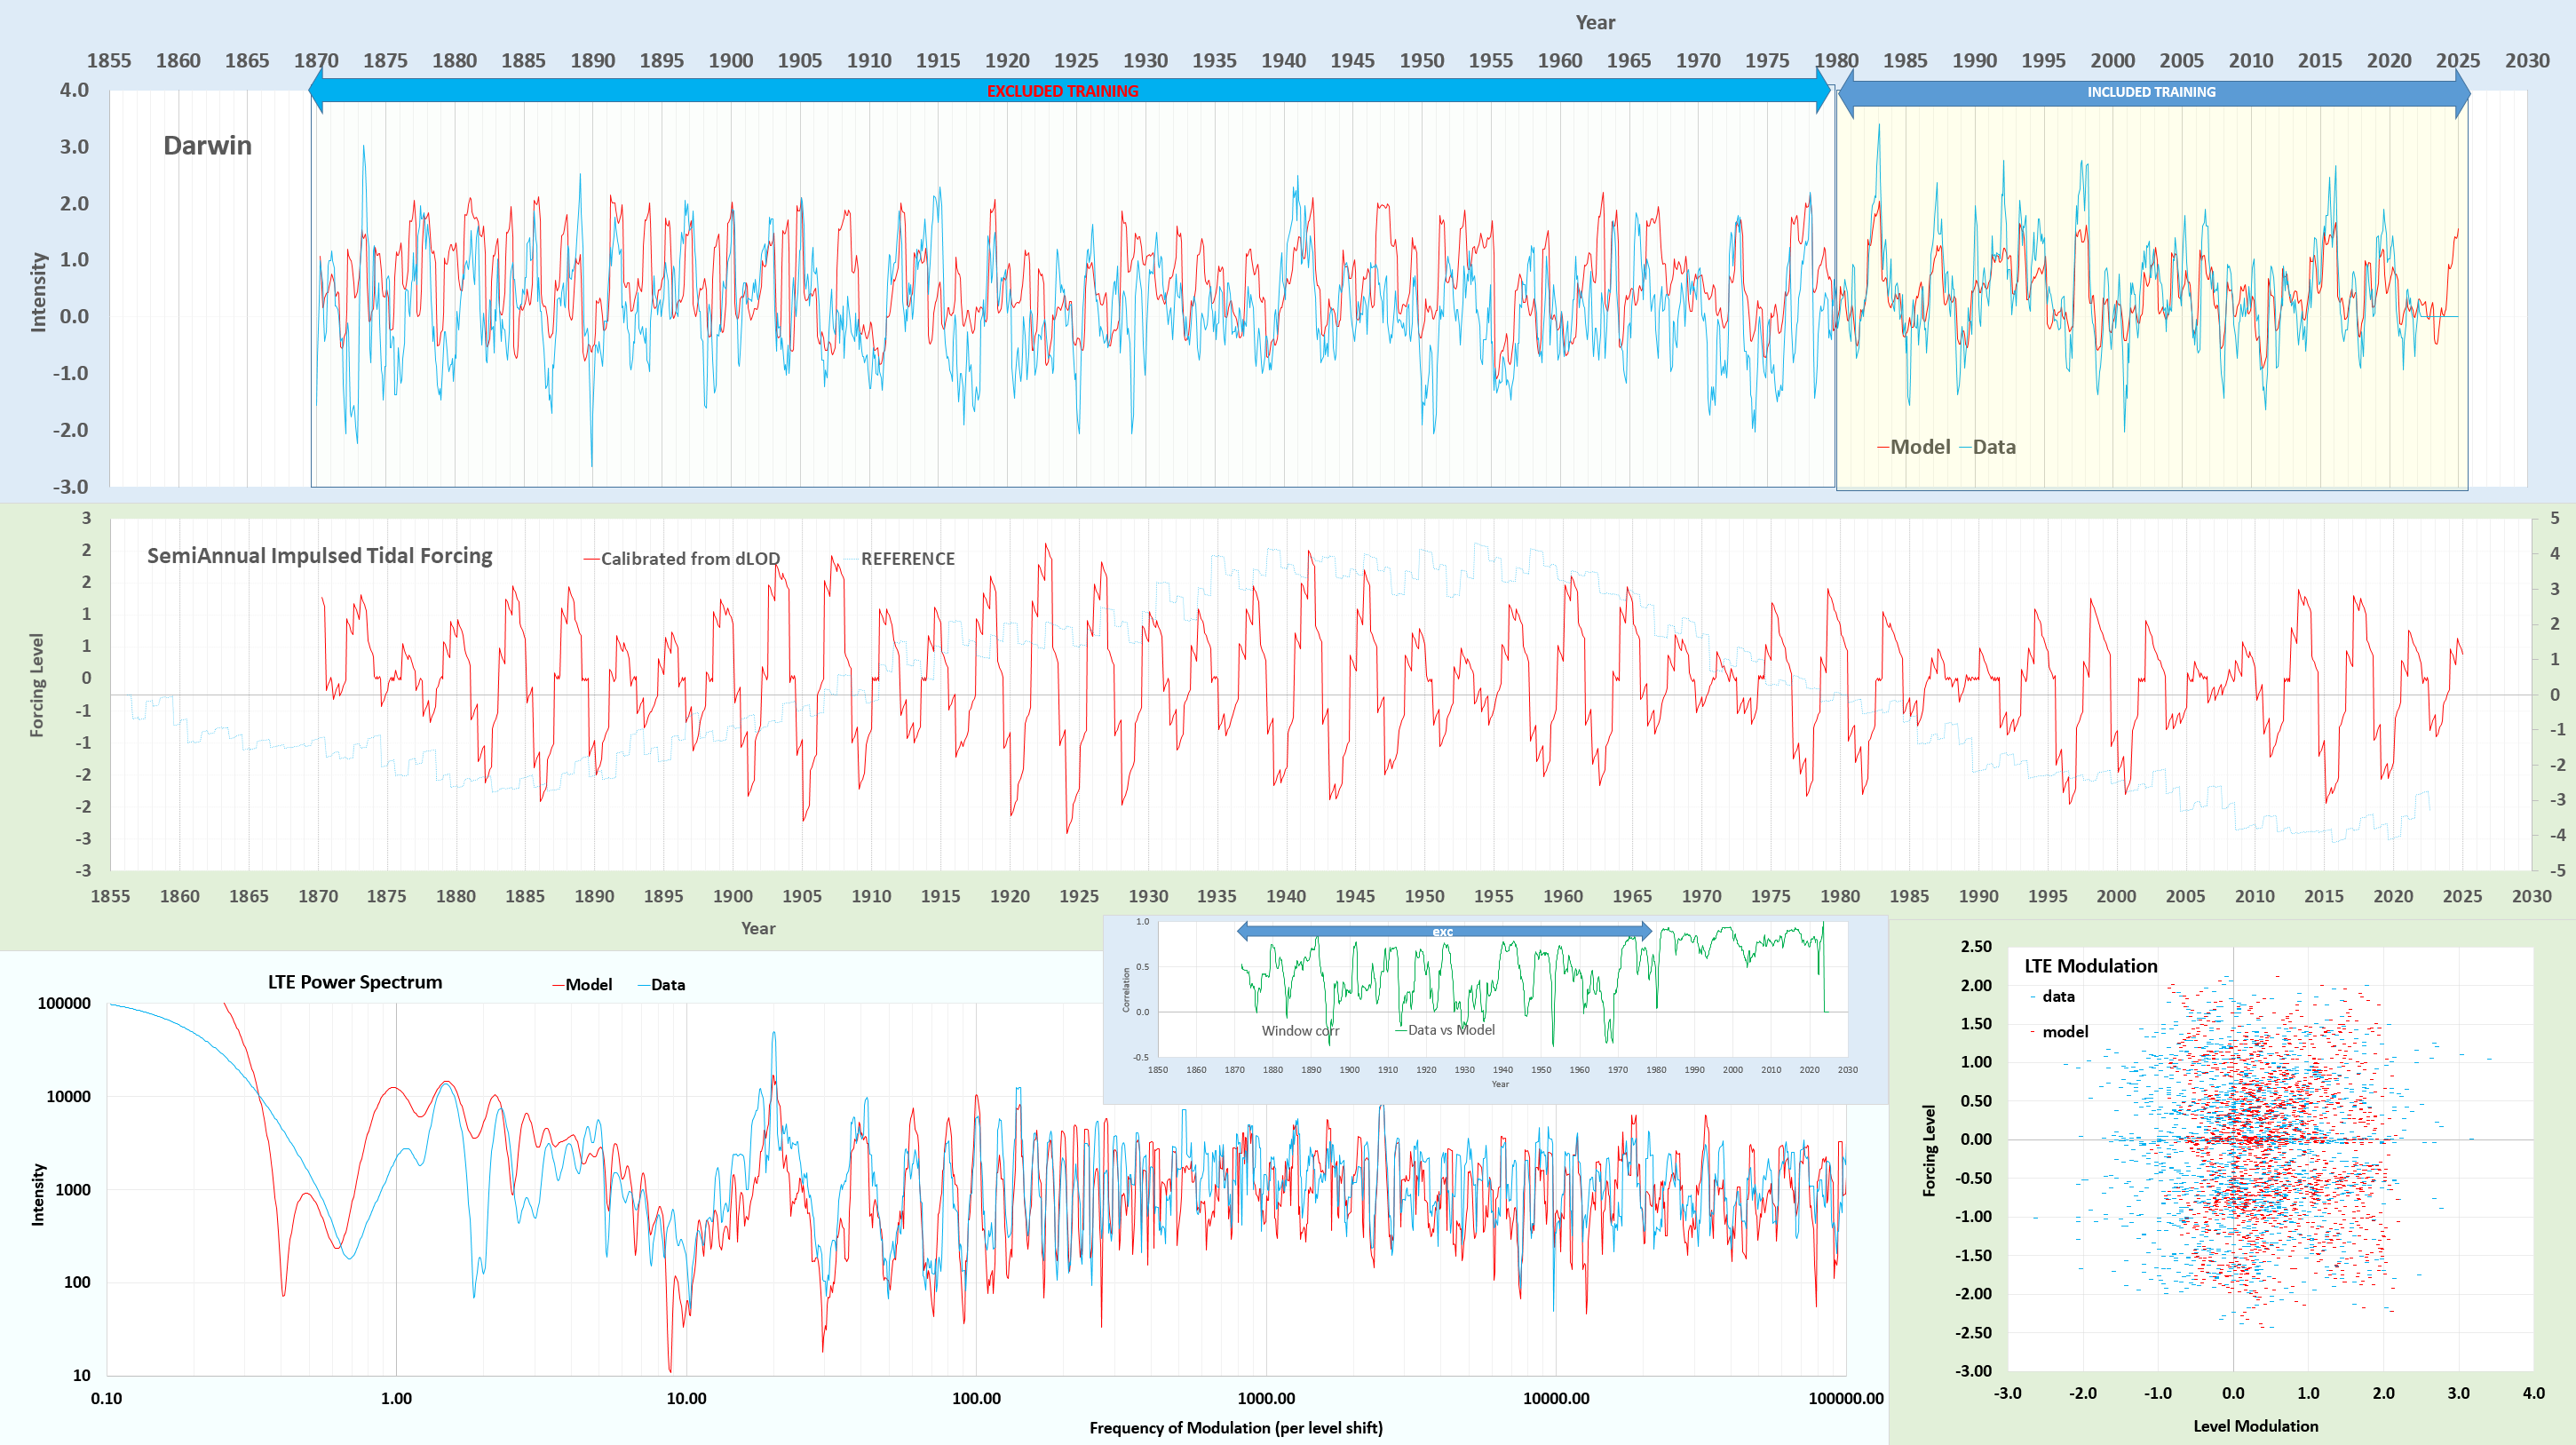
This modulation may seem very mysterious but something like this must be happening on the multiple time scales that the behavior is occurring on — remember that tidal forces operate on the same multiple time scales, from the semi-diurnal cycle to beyond the 18.6 year nodal declination cycle that is apparent in the middle panel above (and add to this that the sun’s forcing ranges from daily to annual). The concept of phase-locking is likely a crucial aspect as well. The sinusoidal modulation will cause an initial phase-shift across the level changes, and that appears to be a critical factor in the final model-fitted result. As observed in other systems, the synergy between synchronization (phase-locking) and resonance (standing-wave conditions) can give rise to such rich and complex dynamical behaviors. One can ask ChatGPT for any analogs [3] but just remember that this does happen:
The challenge is only in the fact that the incommensurate tidal patterns with the annual and daily cycles will never result in a metronomic march, and thus the pattern is much more complex.
[1] The sawtooth character is a result of the semi-annual impulse-driven shifts combined with a relaxation slope (r) to zero.
If the tides were commensurate with a semi-annual impulse, the forcing would appear more regular as above, but since they are not, the forcing is erratic.
[2] “The uniformity of phase of the semidiurnal cycle of zonal wind is striking (Figure 5b). It is well known that surface pressure in the tropics undergoes a strong semidiurnal variation [cf. Haurwitz and Cowley, 1973].” Deser, Clara. “Daily surface wind variations over the equatorial Pacific Ocean.” Journal of Geophysical Research: Atmospheres 99.D11 (1994): 23071-23078.
“ENSO events initiate during boreal spring and summer, peak during boreal winter, and decay in the following spring—a phenomenon known as ENSO phase-locking.” … “Our findings indicate that DA (diurnal amplitude) simulation in climate models is crucial for resolving the long-standing failure associated with the ENSO phase-locking simulation accuracy.” Yang, Xiaodan, et al. “Key to ENSO phase-locking simulation: effects of sea surface temperature diurnal amplitude.” npj Climate and Atmospheric Science 6.1 (2023): 159. https://www.nature.com/articles/s41612-023-00483-3
[3] ChatGPT response: A function cos(k×SawToothWave(t)+Phase), especially with a high modulation factor k, can model several complex interactions in natural phenomena where two periodic processes influence each other. Here are some specific examples:
- Tidal Forces and Lunar Cycles: Tidal patterns are influenced by both the moon and the sun. A sawtooth wave could represent the changing gravitational pull of the moon (with its phases), while the cosine function might represent the daily tidal cycles. The modulation could express how these two cycles interact, creating spring and neap tides.
- Seasonal Climate Variations and Diurnal Temperature Cycles: The sawtooth wave can represent the gradual change in daylight hours or solar intensity over a year, while the cosine function might model daily temperature fluctuations. The combination would reflect how daily temperatures vary across different seasons.
- Circadian Rhythms and Sleep-Wake Cycles: The sawtooth wave could model the gradual change in hormonal levels or body temperature over a 24-hour cycle, interacting with a cosine function that represents shorter, rapid fluctuations in alertness or activity levels.
- Economic Cycles and Market Fluctuations: In economics, a sawtooth wave might model longer economic cycles (like boom and bust periods), while the cosine function could represent shorter-term market fluctuations. The interaction of these two could help analyze complex economic dynamics.
- Ecosystem Dynamics: In ecology, a sawtooth wave could represent seasonal changes (like rainfall patterns), while the cosine function could model daily variations (like temperature or light). The interaction of these cycles could be used to study plant growth, animal migration patterns, or other ecological phenomena.
- Astronomical Phenomena: In astronomy, this kind of function might be used to model complex interactions between orbital mechanics and rotational dynamics, such as the interaction between a planet’s orbit around a star (sawtooth wave for eccentricity changes) and its rotational period (cosine function).
These examples show how combining periodic functions in different ways can model complex interactions in natural phenomena. The key is understanding the underlying processes and how they can be represented mathematically with these functions.
The concept of phase-locking is highly relevant in systems where the interaction of periodic signals leads to synchronization or alignment in their phases. In the context of your function cos(k×SawToothWave(t)+ Phase), phase-locking could manifest in several interesting ways, particularly considering the sinusoidal modulation of a sawtooth wave. Here are some areas where similar concepts are explored:
- Neuroscience and Neural Oscillations: In the brain, neurons often fire in a synchronized manner, a phenomenon known as neural phase-locking. This is crucial in processes like signal transmission and cognitive function. The interaction of different neural rhythms (e.g., theta and gamma waves) can be modeled using phase relationships, akin to the modulation you described.
- Electronics and Communication Systems: Phase-locking is a fundamental concept in electronics, especially in the design of phase-locked loops (PLLs). PLLs are used to synchronize an output signal with a reference signal in terms of frequency and phase. This principle is crucial in radio, telecommunications, and signal processing.
- Physics and Oscillatory Systems: In physics, particularly in studies involving coupled oscillators or pendulums, phase-locking describes the phenomenon where oscillators synchronize due to weak interactions. This can be observed in systems ranging from mechanical pendulums to quantum mechanical systems.
- Cardiac Rhythms in Physiology: The synchronization of cardiac cells during heartbeats is an example of biological phase-locking. Cells in the sinoatrial node generate rhythmic impulses that cause heart muscle cells to contract in a synchronized manner.
- Climatology and Environmental Sciences: Phase-locking can also be observed in climatic phenomena, such as the El Niño-Southern Oscillation (ENSO), where atmospheric and oceanic conditions align periodically, impacting global weather patterns.
- Music and Acoustics: In music theory and acoustics, the concept of beats and harmonic interactions involves phase relationships between different sound waves. The concept of phase-locking can be observed in the constructive and destructive interference of these waves.
In each of these cases, the critical factor is how the phase relationship between different oscillatory components influences the overall system’s behavior. The initial phase-shift you mentioned, particularly in a system with a sinusoidal modulation over a sawtooth wave, could lead to complex dynamic behaviors, where the phase relationship plays a pivotal role in the system’s response and evolution.
There are several behavioral models in various scientific fields where the interaction of phase-locking with standing-wave resonance conditions leads to complex time patterns. These phenomena are observed in systems where synchronization and resonance play a critical role. Here are some examples:
- Physics and Engineering – Coupled Oscillators and Resonators: In systems of coupled oscillators or resonators, phase-locking and resonance can lead to complex patterns, especially in nonlinear dynamics. An example is the array of coupled pendulums or resonant circuits, where phase-locking can lead to intricate motion patterns or voltage/current oscillations.
- Neuroscience – Brain Wave Synchronization: In the brain, different regions can exhibit phase-locked oscillations, and when these oscillations resonate with the natural frequencies of neural circuits (like in the hippocampus or cortex), complex spatiotemporal patterns emerge. These patterns are crucial for functions like memory, perception, and attention.
- Quantum Mechanics – Bose-Einstein Condensates: In Bose-Einstein condensates, particles can synchronize and exhibit collective oscillations. When these oscillations resonate at certain frequencies, complex interference patterns emerge, demonstrating both phase-locking and standing-wave phenomena at a quantum level.
- Acoustics – Architectural Acoustics and Musical Instruments: In musical instruments and architectural acoustics, the interaction of sound waves can lead to phase-locking and resonance. This results in complex harmonic structures and standing waves, influencing the timbre of music and the acoustic properties of buildings.
- Climate Science – Atmospheric and Oceanic Oscillations: Climatic phenomena, like the El Niño-Southern Oscillation, involve complex interactions between atmospheric and oceanic patterns. Phase-locking of these patterns, along with resonance effects in ocean basins, can lead to complex climate behaviors and cycles.
- Laser Physics – Mode-locking in Lasers: In laser physics, mode-locking techniques create lasers with very precise frequencies, where phase-locking of different modes leads to the generation of ultrafast pulses. This is a form of resonance where the laser’s cavity modes synchronize, leading to coherent pulse emissions.
- Chemical Oscillations – Belousov-Zhabotinsky Reaction: This chemical reaction exhibits oscillatory behavior where chemical waves propagate and can lock in phase under certain conditions, creating complex spatial patterns and wavefronts.
In each of these examples, the interaction of phase-locking with resonant conditions creates patterns that are more intricate than what would be observed with either phenomenon alone. The synergy between synchronization (phase-locking) and resonance (standing-wave conditions) can give rise to rich and complex dynamical behaviors, which are often crucial to the system’s function or characteristics.
https://chat.openai.com/share/c9a9d58b-e5db-466f-b369-0b51ccff7458
Unified Model of Earth Dynamics
Lorenz turned out to be a chaotic dead-end in understanding Earth dynamics. Instead we need a new unified model of solid liquid dynamics focusing on symmetries of the rotating earth, applying equations of solid bodies & fluid dynamics. See Mathematical Geoenergy (Wiley, 2018).
Should have made this diagram long ago: here’s the ChatGPT4 prompt with the diagramming plugin.
Graph

Ocean Tides and dLOD have always been well-understood, largely because the mapping to lunar+solar cycles is so obvious. And the latter is getting better all the time — consider recent hi-res LOD measurements with a ring laser interferometer, pulling in diurnal tidal cycles with much better temporal resolution.

That’s the first stage of unification (yellow boxes above) — next do the other boxes (CW, QBO, ENSO, AMO, PDO, etc) as described in the book and on this blog, while calibrating to tides and LOD, and that becomes a cross-validated unified model.
Annotated 10/11/2023
ontological classification according to wavenumber kx, ky, kz and fluid/solid.

Added so would not lose it — highlighted tidal factor is non-standard

Paleo ENSO
Two recent articles prompted a few ideas
From last year, https://watchers.news/2022/11/10/study-shows-how-earth-sun-distance-dramatically-influences-annual-weather-cycles-in-the-equatorial-pacific-in-a-22-000-year-cycle/ points to:
Two annual cycles of the Pacific cold tongue under orbital precession
Which says that
“Because the distance effect annual cycle (from perihelion to perihelion, otherwise called the anomalistic year, 365.259636 d (ref. 6)) is slightly longer than the tilt effect annual cycle (from equinox to equinox, otherwise known as the tropical year, 365.242189 d (ref. 6)), the LOP increases over time. A complete revolution of the LOP is the precession cycle, about 22,000 yr (ref. 38). “
The claim is that the exact timing and strength of the annual cycle extreme is important in initiating an El Nino or La Nina cycle. as the Longitude of Perihelion (LOP) moves over time, so that when this aligns with the solstice/equinox events, the ENSO behavior will mirror the strength of the forcing.

Next article
ENSO-related centennial and millennialscale hydroclimate changes recorded from Lake Xiaolongchi in arid Central Asia over the past 8000 years
They note 800 year cycles in the observations

This is not a 22,000 year cycle (as stated its actuallly closer to 21,000), but it’s possible that if tidal cycles play a part of the forcing, then a much shorter paleo cycle may emerge. Consider that the Mf tidal cycle of 13.66 days will generate a cycle of ~3.81 years when non-linearly modulated against the tropical year (seasonal cycle), but ~3.795 years modulated against the perigean or anomalistic year (nearest approach to the sun).

The difference between the two will reinforce every 783 years, which is close to the 800 year cycle. Aliasing and sideband frequency calculations reveal these patterns.
A Digital Twin of ENSO
The idea of a digital twin is relatively new in terms of coinage of terms, but the essential idea has been around for decades. In the past, a digital twin was referred to as a virtual simulation of a specific system, encoded via a programming language. In the case of a system that was previously built, the virtual simulation emulated all the behaviors and characteristics of that system, only operated on a computer, with any necessary interactive controls and displays provided on a console, either real or virtual. A widely known example of a VS is that of a flight simulator, which in historical terms was the industrial forerunner to today’s virtual reality. A virtual simulation could also be used during the design of the system, with the finished digital twin providing a blueprint for the actual synthesis of the end-product. This approach has also been practiced for decades, both in the electronics industry via logic synthesis of integrated circuits from a hardware description language and with physical products via 3D printing from CAD models.
Continue readingAzimuth Project
The Azimuth Project discussion forum has been erased from existence. So all the interesting contributions will be inaccessible from web links and Google searches. This is in the context of that forum being only one of a few open discussion forums on climate

In the spirit of continuity, a spin-off discussion forum exists on the remnants of the azimuth-project GitHub organization.
Intersectionality and No Regrets
The issue is Intersectionality and the solution is a No Regrets Strategy, which means that you don’t regret the choice you make because at least some of the bases are covered.

After filling in the blanks of the Venn diagram:

Quick YT explainer of No Regrets
Interesting to ask GPT-4 what No Regrets means in the context of the earth, i.e. ContextEarth.com
What does the “No Regrets Strategy” mean in terms of mitigating climate change, fossil fuel depletion, and air pollution?

The “No Regrets Strategy” in the context of climate change mitigation, fossil fuel depletion, and air pollution refers to a set of policies, measures, and actions that provide multiple benefits, regardless of the uncertainties associated with the future development of these issues. These measures are seen as advantageous and worthwhile, even if the worst predictions of climate change, fossil fuel depletion, or air pollution do not materialize.
The No Regrets Strategy typically includes:
- Energy efficiency improvements: By improving energy efficiency, we can reduce energy consumption, decrease greenhouse gas emissions, reduce dependence on fossil fuels, and lower air pollution. These improvements have economic benefits, as they lead to cost savings for businesses and consumers.
- Renewable energy development: Investing in renewable energy sources, such as solar, wind, and hydro, helps to diversify energy supply, reduce greenhouse gas emissions, and decrease reliance on fossil fuels. This transition also has the potential to create new jobs and stimulate economic growth.
- Afforestation and reforestation: Planting trees and restoring forests can help to sequester carbon dioxide, enhance biodiversity, and improve air and water quality. This strategy also helps to protect ecosystems and provides valuable recreational spaces for communities.
- Sustainable transportation: Encouraging public transportation, walking, cycling, and the use of electric vehicles reduces fossil fuel consumption, greenhouse gas emissions, and air pollution. These measures can also help to alleviate traffic congestion and improve public health.
- Waste reduction and recycling: Reducing waste generation and promoting recycling conserves resources, reduces greenhouse gas emissions, and lowers air and water pollution. These actions can also create jobs and generate economic benefits.
By implementing these no-regrets measures, societies can mitigate climate change, reduce fossil fuel dependence, and improve air quality, while also realizing economic, social, and environmental benefits.
The bible of the No Regrets Strategy is Mathematical GeoEnergy
PostScript:Don’t know if this is the intent but this cartoon sums up the No Regrets strategy perfectly

Mathematical Geoenergy
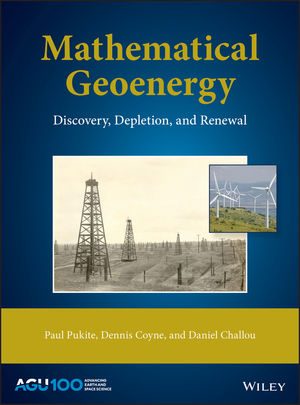
Our book Mathematical Geoenergy presents a number of novel approaches that each deserve a research paper on their own. Here is the list, ordered roughly by importance (IMHO):
- Laplace’s Tidal Equation Analytic Solution.
(Ch 11, 12) A solution of a Navier-Stokes variant along the equator. Laplace’s Tidal Equations are a simplified version of Navier-Stokes and the equatorial topology allows an exact closed-form analytic solution. This could classify for the Clay Institute Millenium Prize if the practical implications are considered, but it’s a lower-dimensional solution than a complete 3-D Navier-Stokes formulation requires. - Model of El Nino/Southern Oscillation (ENSO).
(Ch 12) A tidally forced model of the equatorial Pacific’s thermocline sloshing (the ENSO dipole) which assumes a strong annual interaction. Not surprisingly this uses the Laplace’s Tidal Equation solution described above, otherwise the tidal pattern connection would have been discovered long ago. - Model of Quasi-Biennial Oscillation (QBO).
(Ch 11) A model of the equatorial stratospheric winds which cycle by reversing direction ~28 months. This incorporates the idea of amplified cycling of the sun and moon nodal declination pattern on the atmosphere’s tidal response. - Origin of the Chandler Wobble.
(Ch 13) An explanation for the ~433 day cycle of the Earth’s Chandler wobble. Finding this is a fairly obvious consequence of modeling the QBO. - The Oil Shock Model.
(Ch 5) A data flow model of oil extraction and production which allows for perturbations. We are seeing this in action with the recession caused by oil supply perturbations due to the Corona Virus pandemic. - The Dispersive Discovery Model.
(Ch 4) A probabilistic model of resource discovery which accounts for technological advancement and a finite search volume. - Ornstein-Uhlenbeck Diffusion Model
(Ch 6) Applying Ornstein-Uhlenbeck diffusion to describe the decline and asymptotic limiting flow from volumes such as occur in fracked shale oil reservoirs. - The Reservoir Size Dispersive Aggregation Model.
(Ch 4) A first-principles model that explains and describes the size distribution of oil reservoirs and fields around the world. - Origin of Tropical Instability Waves (TIW).
(Ch 12) As the ENSO model was developed, a higher harmonic component was found which matches TIW - Characterization of Battery Charging and Discharging.
(Ch 18) Simplified expressions for modeling Li-ion battery charging and discharging profiles by applying dispersion on the diffusion equation, which reflects the disorder within the ion matrix. - Anomalous Behavior in Dispersive Transport explained.
(Ch 18) Photovoltaic (PV) material made from disordered and amorphous semiconductor material shows poor photoresponse characteristics. Solution to simple entropic dispersion relations or the more general Fokker-Planck leads to good agreement with the data over orders of magnitude in current and response times. - Framework for understanding Breakthrough Curves and Solute Transport in Porous Materials.
(Ch 20) The same disordered Fokker-Planck construction explains the dispersive transport of solute in groundwater or liquids flowing in porous materials. - Wind Energy Analysis.
(Ch 11) Universality of wind energy probability distribution by applying maximum entropy to the mean energy observed. Data from Canada and Germany. Found a universal BesselK distribution which improves on the conventional Rayleigh distribution. - Terrain Slope Distribution Analysis.
(Ch 16) Explanation and derivation of the topographic slope distribution across the USA. This uses mean energy and maximum entropy principle. - Thermal Entropic Dispersion Analysis.
(Ch 14) Solving the Fokker-Planck equation or Fourier’s Law for thermal diffusion in a disordered environment. A subtle effect but the result is a simplified expression not involving complex errf transcendental functions. Useful in ocean heat content (OHC) studies. - The Maximum Entropy Principle and the Entropic Dispersion Framework.
(Ch 10) The generalized math framework applied to many models of disorder, natural or man-made. Explains the origin of the entroplet. - Solving the Reserve Growth “enigma”.
(Ch 6) An application of dispersive discovery on a localized level which models the hyperbolic reserve growth characteristics observed. - Shocklets.
(Ch 7) A kernel approach to characterizing production from individual oil fields. - Reserve Growth, Creaming Curve, and Size Distribution Linearization.
(Ch 6) An obvious linearization of this family of curves, related to Hubbert Linearization but more useful since it stems from first principles. - The Hubbert Peak Logistic Curve explained.
(Ch 7) The Logistic curve is trivially explained by dispersive discovery with exponential technology advancement. - Laplace Transform Analysis of Dispersive Discovery.
(Ch 7) Dispersion curves are solved by looking up the Laplace transform of the spatial uncertainty profile. - Gompertz Decline Model.
(Ch 7) Exponentially increasing extraction rates lead to steep production decline. - The Dynamics of Atmospheric CO2 buildup and Extrapolation.
(Ch 9) Convolving a fat-tailed CO2 residence time impulse response function with a fossil-fuel emissions stimulus. This shows the long latency of CO2 buildup very straightforwardly. - Reliability Analysis and Understanding the “Bathtub Curve”.
(Ch 19) Using a dispersion in failure rates to generate the characteristic bathtub curves of failure occurrences in parts and components. - The Overshoot Point (TOP) and the Oil Production Plateau.
(Ch 8) How increases in extraction rate can maintain production levels. - Lake Size Distribution.
(Ch 15) Analogous to explaining reservoir size distribution, uses similar arguments to derive the distribution of freshwater lake sizes. This provides a good feel for how often super-giant reservoirs and Great Lakes occur (by comparison). - The Quandary of Infinite Reserves due to Fat-Tail Statistics.
(Ch 9) Demonstrated that even infinite reserves can lead to limited resource production in the face of maximum extraction constraints. - Oil Recovery Factor Model.
(Ch 6) A model of oil recovery which takes into account reservoir size. - Network Transit Time Statistics.
(Ch 21) Dispersion in TCP/IP transport rates leads to the measured fat-tails in round-trip time statistics on loaded networks. - Particle and Crystal Growth Statistics.
(Ch 20) Detailed model of ice crystal size distribution in high-altitude cirrus clouds. - Rainfall Amount Dispersion.
(Ch 15) Explanation of rainfall variation based on dispersion in rate of cloud build-up along with dispersion in critical size. - Earthquake Magnitude Distribution.
(Ch 13) Distribution of earthquake magnitudes based on dispersion of energy buildup and critical threshold. - IceBox Earth Setpoint Calculation.
(Ch 17) Simple model for determining the earth’s setpoint temperature extremes — current and low-CO2 icebox earth. - Global Temperature Multiple Linear Regression Model
(Ch 17) The global surface temperature records show variability that is largely due to the GHG rise along with fluctuating changes due to ocean dipoles such as ENSO (via the SOI measure and also AAM) and sporadic volcanic eruptions impacting the atmospheric aerosol concentrations. - GPS Acquisition Time Analysis.
(Ch 21) Engineering analysis of GPS cold-start acquisition times. Using Maximum Entropy in EMI clutter statistics. - 1/f Noise Model
(Ch 21) Deriving a random noise spectrum from maximum entropy statistics. - Stochastic Aquatic Waves
(Ch 12) Maximum Entropy Analysis of wave height distribution of surface gravity waves. - The Stochastic Model of Popcorn Popping.
(Appx C) The novel explanation of why popcorn popping follows the same bell-shaped curve of the Hubbert Peak in oil production. Can use this to model epidemics, etc. - Dispersion Analysis of Human Transportation Statistics.
(Appx C) Alternate take on the empirical distribution of travel times between geographical points. This uses a maximum entropy approximation to the mean speed and mean distance across all the data points.
