In Chapter 12 of the book, we have a description of the mechanism forcing the El Nino / Southern Oscillation (ENSO) behavior. An important ingredient to the modeled forcing is an annual impulse (with a likely biennial asymmetry) that modulates the hypothesized lunar tidal forcing. We will show next how to confirm that the annual impulse exists simply by analyzing the ENSO power spectrum …
As we describe in Chapter 12, a strong seasonally-localized annual impulse will act as a frequency modulator to other cyclic factors such that the spectral components will repeat as 1/annual harmonics in reciprocal space. Thus, a spectral peak that occurs at a frequency f0 should also occur at f0+1, f0+2, etc.
To show this for a range of spectral peaks, the convenient approach is to perform an auto-correlation in the frequency domain. First, to properly scale the effect, the Fourier transform of the time derivative of the ENSO time-series is taken. The derivative serves to magnify the contribution of the higher frequency harmonics. The auto-correlation of the calculated spectrum then provides a simple way to show how well the harmonics repeat in frequency space. As you can see below, spikes show up at shifts of 0, 1, and 2, with the spike at 1 showing strong statistical significance for the occurrence for the annual impulse modulation. The shift at 2 further substantiates its existence.

The spike at a shift of 1/year is illustrated by the chart below, where the busy sin() amplitude spectrum is shifted by 1/year and overlaid.

Edited/Added: 9/25/2019
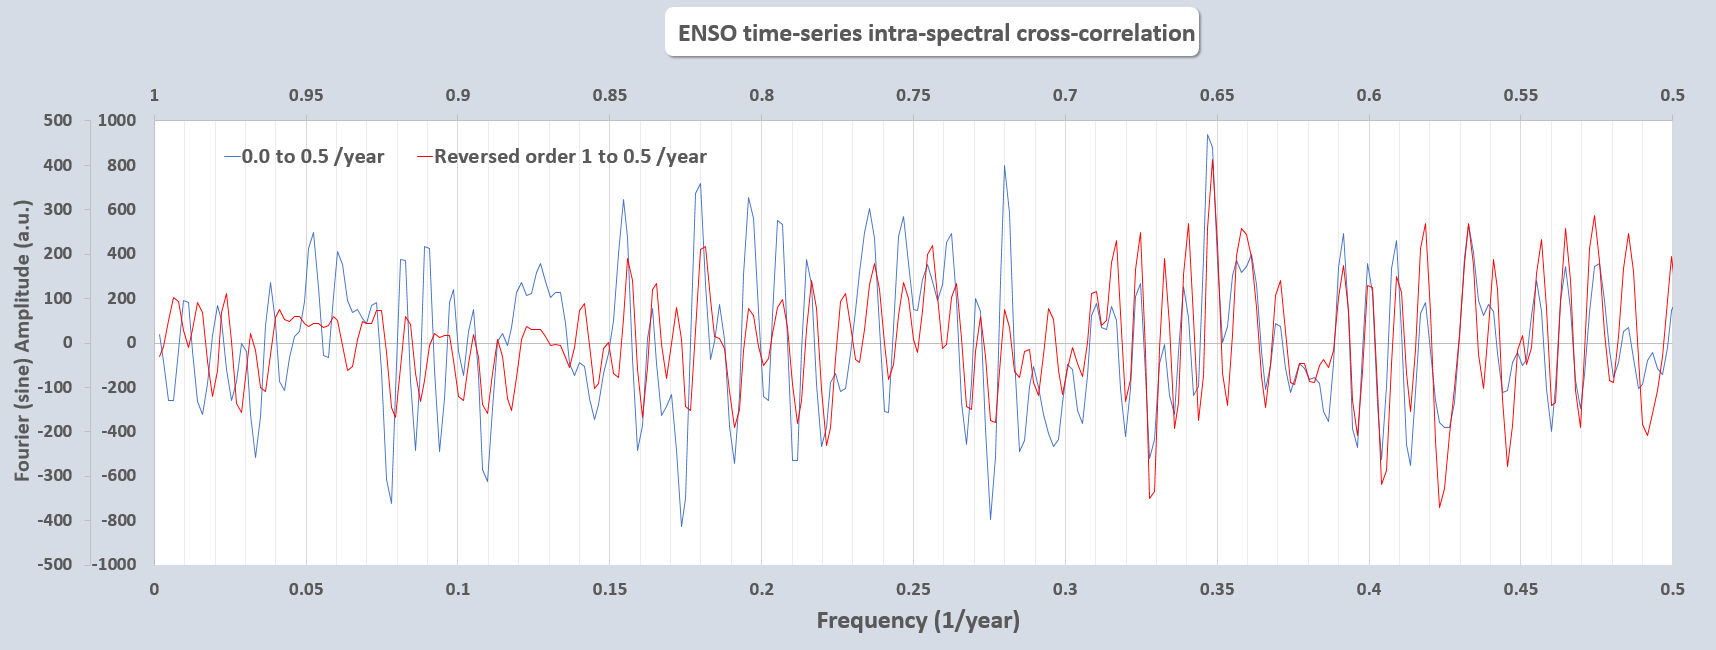
Instead of sliding the spectrum by 1/year, can shift and reverse by 0.5/year (i.e. folded) to quantify the underlying forcing symmetry. The correlation coefficient is ~0.6 which is impossible to attain with a stochastic auto-regressive spectrum.
Added by PP on 9/25/2019
(click to enlarge)
Compare this to the model tidal forcing where the spectrum is not folded as above but the symmetry around 0.5 /year (and 1.5 /year) is clearly apparent.
(click to enlarge)
The folded cross-correlation of the model forcing is above 0.9, so the idea is that the LTE modulation is responsible for the multiple splitting of the peaks in the forcing response, thus degrading the symmetry to some degree.


This is a novel way of confirming the existence of the annual impulse modulation, and an approach not readily found in the research literature.
Other kinds of cross-spectral analyses are being used as described in the class notes below, which we applied as a frequency-domain cross-validation approach in our 2018 AGU presentation
- D. Hartmann, “6.4 Mixed Space-Time Spectral Analysis.” [Online]. Available: https://atmos.washington.edu/~dennis/552_Notes_6c.pdf. [Accessed: 27-Oct-2018].
Note that being able to extract the 1-year delay is a consequence of Floquet (math) or Bloch theory (condensed matter physics), concisely expressed as F(t) = exp(-iωt)P(t), whereby a clear periodic function can be extracted from a signal. The other underlying signal, P(t), can be complex in nature, for example, a Mathieu function due to fluid sloshing in a container or it can be a set of multi-factored sinusoidal signals further modified by the solution to Laplace’s tidal equations as described in the book chapter.
Pingback: Autocorrelation in Power Spectra, continued | GeoEnergy Math