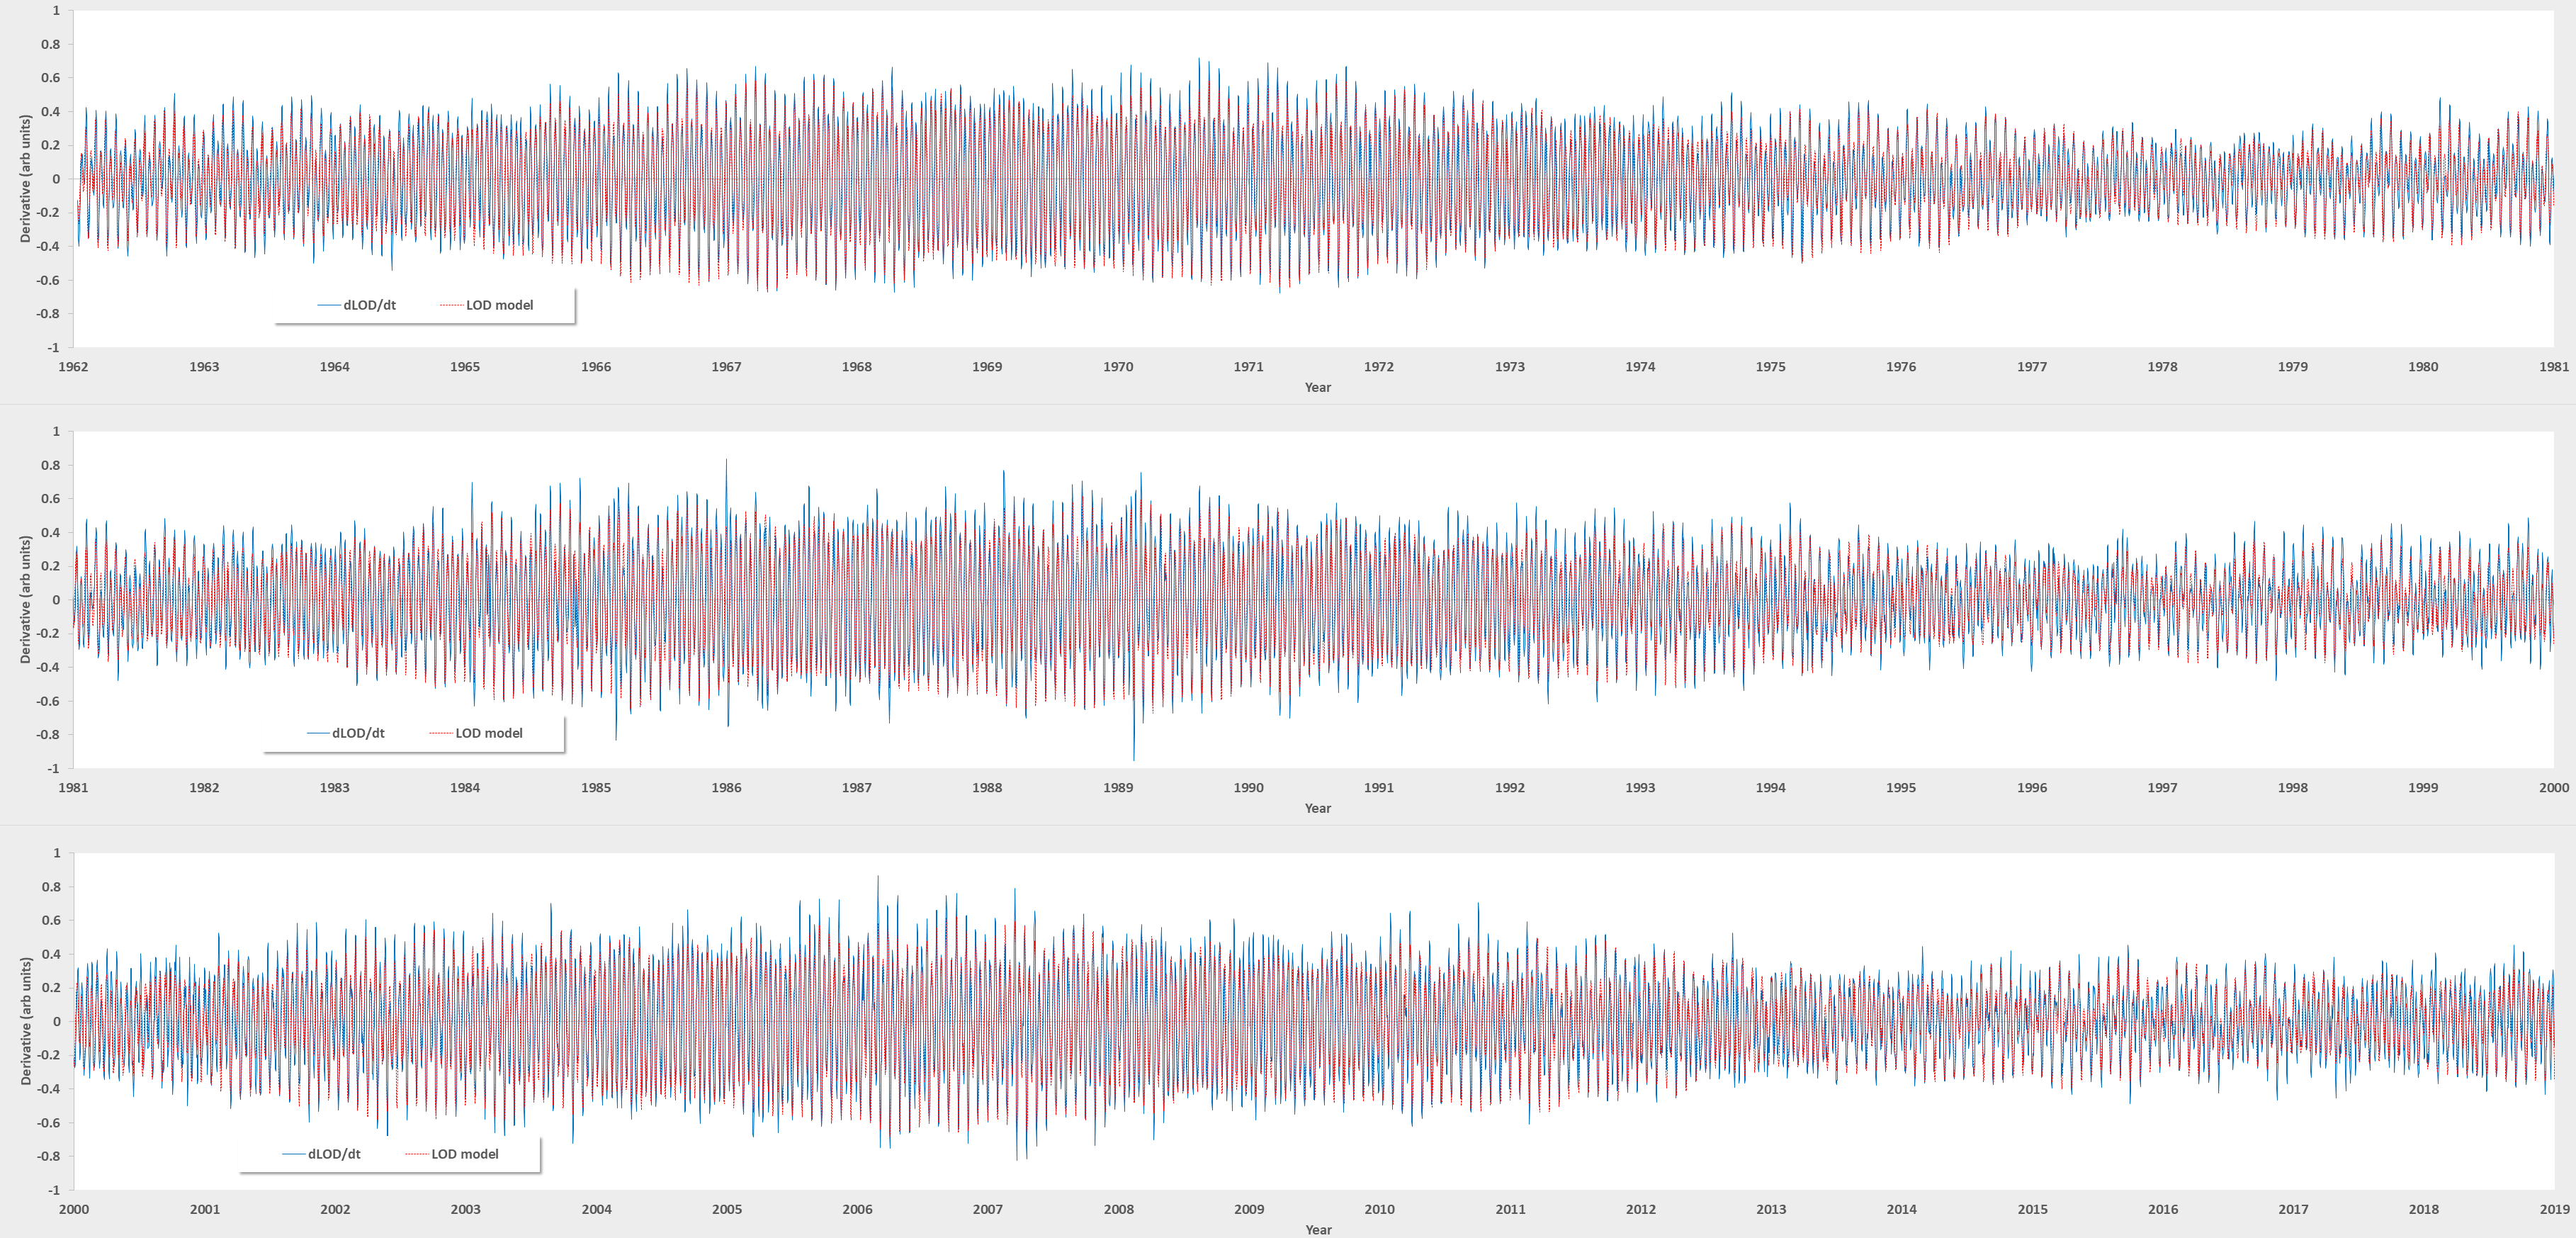
It’s been over 10 years since a thread on simplifying climate models was posted on the Azimuth Project forum => https://forum.azimuthproject.org/discussion/981/the-fruit-fly-of-climate-models
A highly esteemed climate scientist, Isaac Held, even participated and voiced his opinion on how feasible that would be. Eventually the forum decided to concentrate on the topic of modeling El Nino cycles, starting out with a burst of enthusiasm. The independent track I took on the forum was relatively idiosyncratic, yet I thought it held promise and eventually published the model in the monograph Mathematical Geoenergy (AGU/Wiley) in late 2018. The forum is nearly dead now, but there is recent thread on “Physicists predict Earth will become a chaotic world”. Have we learned nothing after 10 years?
My model assumes that El Nino/La Nina cycles are not chaotic or random, which is still probably considered blasphemous. In contrast to what’s in the monograph, the model has simplified, and a feasible solution can be mapped to data within minutes. The basic idea remains the same, explained in 3 parts.

- Tidal Forcing. A long-period tidal forcing is generated, best done by fitting the strongest tidal factors (mapped by R.D.Ray) to the dLOD (delta Length-of-Day) data from the Paris Observatory IERS. With a multiple linear regression (MLR) algorithm, that takes less than a second and fits a sine-wave series model to the data with a correlation coefficient higher than 0.99.
- Annual Trigger Barrier. A semi-annual (+/-) excursion impulse train is constructed, which acts as a sample-and-hold input driver when multiplied by the tidal forcing above. A single parameter controls the slight decay of the sampled value, i.e. the hold or integrated response. Another parameter allows for a slight asymmetry in the + excursions, and the – excursions that occur 6 months later. This creates the erratic pseudo-square wave structure shown above. A monthly time-series is sufficient, with the chosen impulse month the most critical parameter.
- Fluid Dynamics Modulation. The Laplace’s Tidal Equations are solved along the equator via an ansatz, which essentially creates a non-linear sin(F(t)) mapping corresponding to standing-wave modes spanning the Pacific Ocean basin. A slow-mode mode(s) is used to characterize the main ENSO dipole, and a faster mode(s) to characterize the tropical instability waves. For each mode, a wavenumber, amplitude, and phase is required to calculate the modulation.
The fitting process is to let all the parameters to vary slightly and so I use the equivalent of a gradient descent algorithm to guide the solution. The impulse month is seeded along with starting guesses for the two slowest wavenumbers. Another MLR algorithm is embedded to estimate the amplitude and phases required.
The multi-processing software is at https://github.com/pukpr/GeoEnergyMath/wiki
Recently it has taken mere minutes to arrive at a viable model fit to the ENSO data (the ENS ONI monthly data (1850 – Jul 2022)), starting with the initially calibrated dLOD factors. Each of the tidal factors is modified slightly but the correlation coefficient is still at 0.99 of the starting dLOD.
Even with that, the only way to make a convincing argument is to apply cross-validation during the fitting process. A training interval is used during the fitting and the model is extrapolated as a check once the training error is minimized. Even though the model is structurally sensitive, it does not show wild over-fitting errors. This is explainable as only a handful of degrees of freedom are available.


So this demonstrates that the behavior is stationary and definitely not chaotic, only obscured by the non-linear modulation applied to tidally forced waveform.

