Continuing with Chapter 13 of the book, we also analyze the factors that perturb the Earth’s rotation rate and therefore the observed length-of-day (LOD). Researchers continue to update the characterization of the LOD, such as here, which we can compare against a straightforward model based on the accepted lunisolar gravitational forcing factors …
The data is available here. The important first step is to characterize the LOD in terms of it’s rate of change over time, i.e. d(LOD)/dt, as this is the closest representation to the forcing applied, which is essentially an impulse change in angular momentum. The longer-term drift in LOD that’s observed is actually caused by forcing terms that are much smaller than the rapid oscillations caused by the lunisolar terms.
When characterized, the envelope of d(LOD)/dt shows the distinctive profile of interference between the nodal lunar cycle of 27.2122 days with a maximum declination every 18.6 years. This is rendered with great detail as shown below (click to expand)
There are at least three 18.6 cycles in the profile matched with a correlation coefficient of over 0.92, which can be magnified by charting over three separate 22-year intervals.
The detail is quite intricate and appears markedly different when represented as the integrated LOD below, The nodal 18.6 year cycles (greater destructive interference shown along the green bars) are not as apparent in this view as the constant annual cycle somewhat obscures the magnitude of the faster lunar tidal cycle.
Here one can also see the slow drift of the LOD, likely caused by a much weaker effective forcing due to gradual rearrangement of the earth’s moment of inertia over time.
For whatever reason, the d(LOD)/dt view is not widely used in the research literature even though it is the most sensitive to characterizing the lunisolar forcing terms.


Another recent article that finds the 18.6 year cycle in LOD, using an AR-z technique as a supplement to Fourier and Max Entropy spectra techniques
H. Ding and B. F. Chao, “Application of stabilized AR‐z spectrum in harmonic analysis for geophysics,” Journal of Geophysical Research: Solid Earth, vol. 123, no. 9, pp. 8249–8259, 2018.
LikeLike
From the Ding & Chao article in the last comment

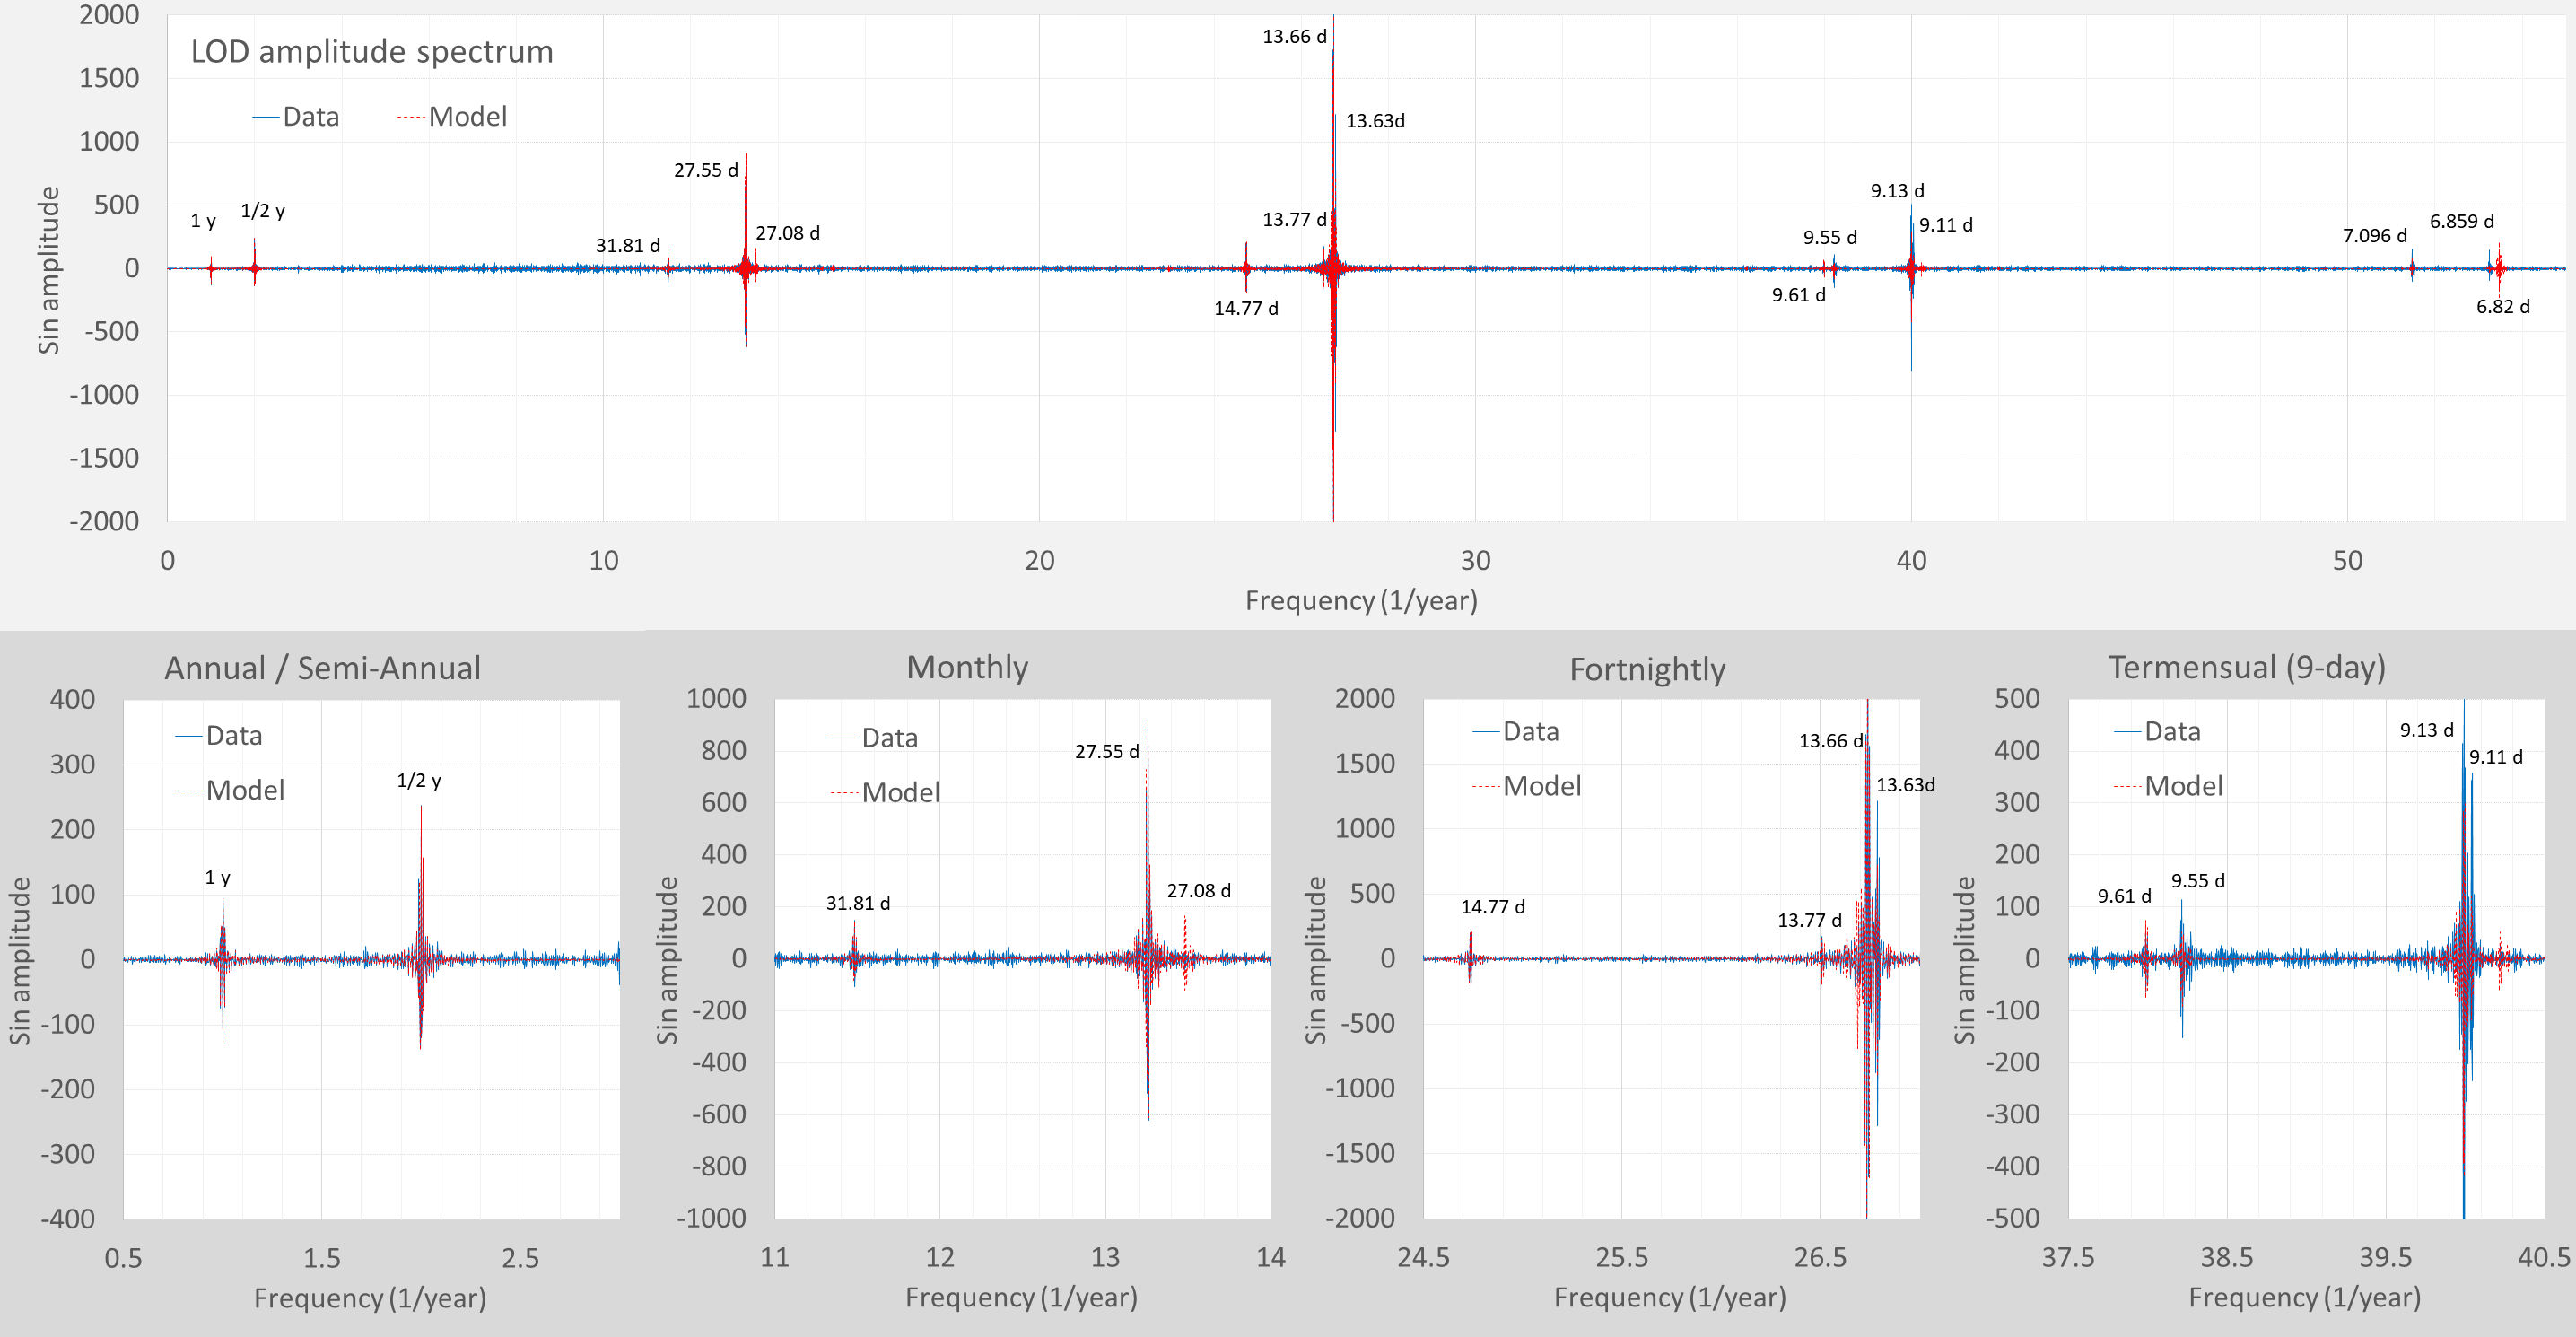
This is my attempt at doing the amplitude spectrum

Captured most of the peak positions, save for a few low-power ones. This was fit via the ENSO gravity model so all of the harmonics are created solely based on the draconic, anomalistic, tropical, and synodic cycles, with the inverse-cube generating the 9-day and 7-day positions. Some generated ones are phantom, so even though the 27.09 day peak is generated and one can see it in the Ding data, it doesn’t show up in my Fourier spectra of the LOD data
LikeLike
Pingback: The AMO | GeoEnergy Math
Pingback: The PDO | GeoEnergy Math
Pingback: Length of Day II | GeoEnergy Math