The Hidden Harmony of ENSO

With this analysis, I wanted to demonstrate the underlying order of the most concise SOI Model. This model characterizes the salient fit parameters:

  1. Two slightly offset forcing sinusoids which match the average QBO forcing cycle
  2. A forcing sinusoid that maps to the frequency of the Chandler wobble beat
  3. A Mathieu modulation perturbing the 2nd-order DiffEq with a periodicity of about 8 years

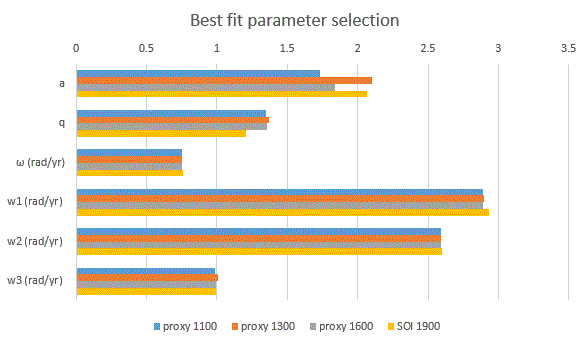
This set of four parameters was used to model both modern day records corresponding to the atmospheric pressure data describing the Southern Oscillation Index, as well as to proxy records of historical coral data. The parameters seem to match closely over widely separated time intervals (see Figure 5 in the latter link).

Figure 1 is the modern-day SOI record, suitably filtered to show the multi-year excursions.

Fig 1: SOI Data. The waveform is erratic, to say the least.

It is amazing that this erratic a waveform can be modeled by a limited set of parameters that actually make some physical sense, but that is nature for you and the idea behind “sloppy modeling” — models that use just a few parameters to accurately describe a behavior. The simplified model strongly suggests that there is a hidden harmony acting to drive ENSO.

Continue reading

Lithium Battery Characterization

In the menu under Stochastic Analysis, I have a white paper called “Characterization of Charge and Discharge Regimes in Lithium-Ion Batteries”.

This is a breakthrough on modeling the fat-tail behavior of Lithium-Ion batteries and something that has a lot of practical analysis benefits considering the push toward common-place use of Li+ technology (see Tesla’s Powerwall and review).

From the introduction:

“Modeling with uncertainty quantification has application to such phenomena as oxidation, corrosion, thermal response, and particulate growth. These fall into the classes of phenomena governed substantially by diffusional processes. At its most fundamental, diffusion is a model of a random walk. Without a strong convection or advection term to guide the process (e.g. provided by an electric or gravitational field), the kinetic mechanism of a particle generates a random trajectory that is well understood based on statistical physics principles. The standard physics approach is to solve a master diffusion equation under transient conditions. This turns into a kernel solution that we can apply to an arbitrary forcing function, such as provided by an input material flux or thermal impulse. In the case of a rechargeable battery, such as Li+, the flux is charged ions under the influence of an electric field.”

Alas, when I tried to submit the paper to ARXIV as a preprint it got rejected. The first time it was rejected due to a mixup in the citation numbering. The second time they said it was removed from the publication queue without exactly saying why, suggesting it be submitted to a “conventional journal” instead.

I do not need that kind of hassle. I can just as easily DIY.

Characterizing Changes in the Angular Momentum of the Earth

Sloshing of the ocean’s waters, as exemplified by ENSO, can only be generated by a suitable forcing. Nothing will spontaneously slosh back and forth unless it gets the right excitation.  Some might hold a naive picture that simply the rotation of the earth can cause the sloshing, but we have to remember that this is a centrifugal force which is evenly directed downward with no changes over time. However, this last part — “no changes over time” — is only correct to zero-th order.  Two classes of mechanisms can disrupt this constant rotation rate.  First, the Chandler wobble of the earth’s axis causes a continuously changing angular momentum of a point of reference. That is a general wobble mechanism similar to the spinning of a top. The second class is of nonspecific events that can either speed up or slow down the rotation rate of the earth.  Note that the wobble may be a behavior that actually belongs to this class, as it may be hard to distinguish the specific mechanisms behind the change in rate. Both of these mechanisms have been measured and they both indicate a clear periodic signal of approximately 6 years.   The Chandler wobble was described in a previous SOI modeling post and it shows a strong average period of 6.45 years see Figure 1 below.

Fig 1: The Chandler Wobble leads to a continuous change of angular momentum of a point of reference, in this case the north pole. A phase shift occurs between 1920 and 1930, but otherwise the period is relatively fixed at 6.45 years, which is the beat frequency of the 433 day wobble and the calendar year.

Continue reading