Dennis suggested:
“I was thinking about ENSO model and the impulse function used to drive it. Could it be the wind shift from the QBO that is related to that impulse function.
5/19/2019
My recollection was that it was a biennial pulse, which timing wise might fit with QBO. “
They are somehow related but more than likely through a common-mode mechanism. Consider that QBO has elements of a semi-annual impulse, as the sun crosses the equator twice per year. The ENSO model has an impulse of once per year, with more recent evidence that it may not have to be biennial (i.e. alternating sign in consecutive years) as we described it in the book.
I had an evaluation Mathematica license for a few weeks so ran several wavelet scalograms on the data and models. Figure 1 below is a comparison of ENSO to the model

The significance of the transformation from the first row to the second row is essentially equivalent to untangling a messy knot with one pull of a string. There is no real order observed in either scalogram on the first row — both appear to be a tangled weave. However, on applying the arcsin() function (derived from the solution to Laplace’s Tidal Equations, also described in the book) to the time-series, the scalograms in the second row immediately show an untangled weave with a distinct pattern. The transition from the second to third row is replacing the Mexican Hat wavelet with a Gabor wavelet window — this reveals the stationarity of distinct cycles even more clearly via the intense wavelet ridges.
As the final step, we can remove the annual pulse in the model to reveal the fundamental tidal forcing. This is the final row in Figure 1, and we can safely assume that this is the same underlying forcing that drives the left-hand-side time-series data.
Now we can contrast the ENSO wavelet scalogram to the QBO scalogram in Figure 2. The top-to-bottom progression is now left-right, with the top row showing ENSO and the bottom row QBO.

The difference with QBO is that the arcsin() transform is slight for QBO, as arcsin(x) ~ x for small x. Also, while the ENSO model includes an annual impulse, the QBO model is a semi-annual impulse. The fourth column can be directly compared to a scalogram for the Earth’s Length-of-Day (LOD) variation shown in the last column. The LOD variation has been long known to track the cyclic lunisolar gravitational forcing as the moon and sun tug on the earth’s rotational inertial geometry. The horizontal scalogram lines can be visually checked to align with the ENSO model, with the details extracted from the model .
So the general wavelet scalogram patterns are very similar for ENSO and QBO. The detailed distinction is that the QBO model uses a Draconic factor as the fundamental forcing (since the standing wave is longitudinally symmetric) while ENSO uses Synodic (as the forcing is strongest in the Pacific).
The semiannual forcing of QBO can be inferred from the Semi-Annual Oscillation (SAO) that exists at higher altitudes than QBO. For ENSO only the model suggests that it is forced annually, although this could be related to the asymmetry in the distribution of Pacific ocean water north and south of the equator (in contrast the stratosphere where the QBO exists has no equivalent asymmetry). That essentially suggests the answer to Dennis’ query at the top, in that the common-mode tidal forcing drives each of ENSO and QBO in a slightly different but complementary fashion..
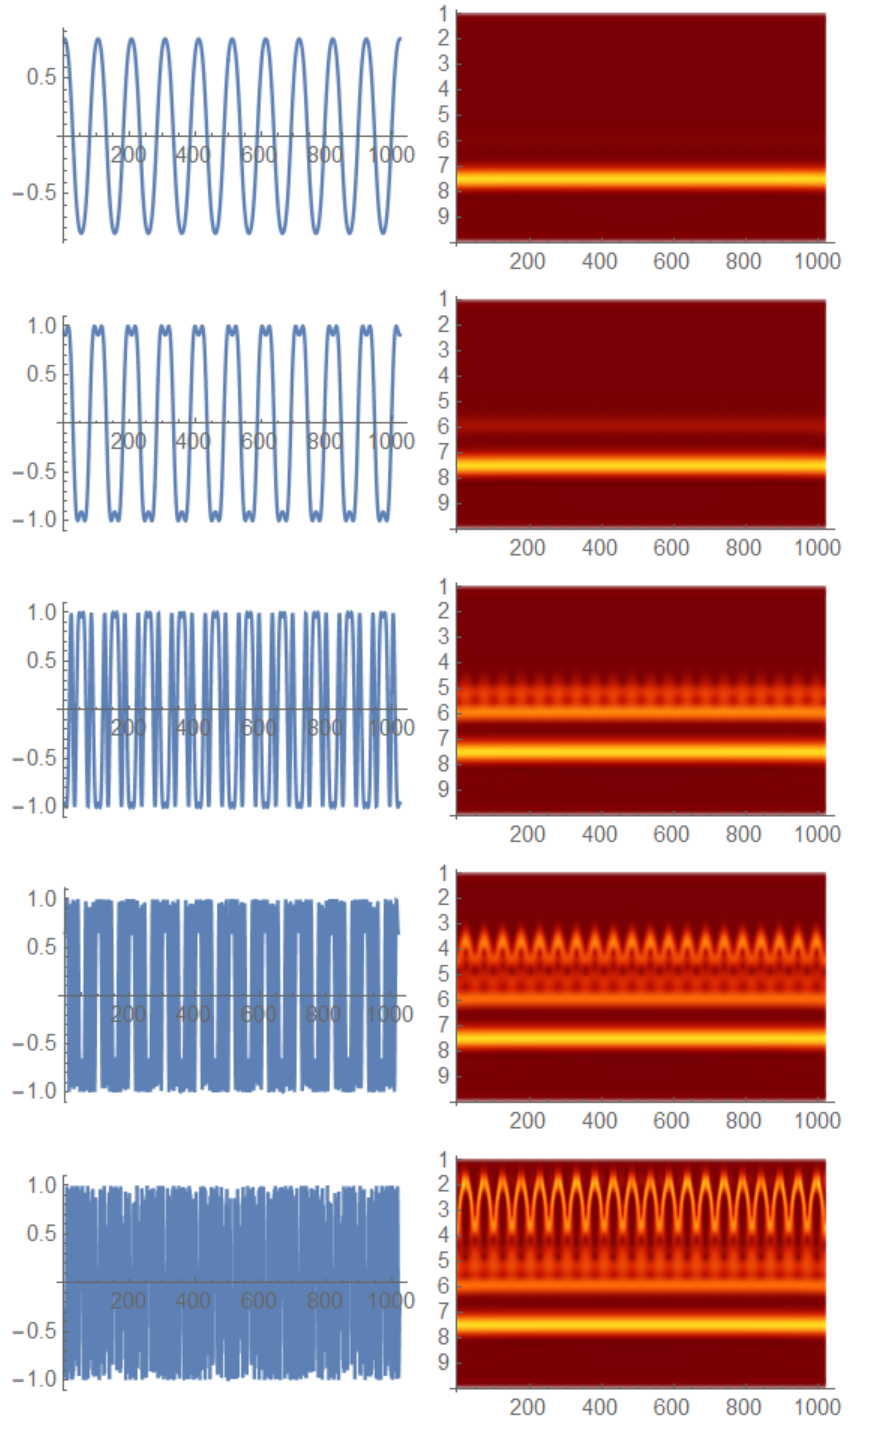
What causes the tangled weave in the first place? That’s again predominately due to the sin() modulation applied to a set of cyclic lunisolar forcing factors. Figure 3 below shows how the severity of the sin(k sin(t)) harmonic distortion increases as k increases.

The modulation factor k is mild for QBO in comparison to that of ENSO, ostensibly originating from the distinction from a low density stratospheric gas and a high density liquid.
Finally, Figure 4 shows the impact that various wavelet transform windows has on scalogram results. The DGaussian and MexicanHat are useful for pattern matching while the Gabor appears more useful for isolating stationary periodicities as it highlights ridges clearly if they exist. Notice again that no distinct and continuous ridges appear in the Gabor scalogram of the ENSO time-series below, indicating a lack of order in the raw data. What the arcsin() function does is cause the order to emerge and be clearly visible in the scalogram via the ridges.

when applied to the raw ENSO time-series