Background: see Chapter 11 of the book.
In research articles published ~50 years ago, Richard Lindzen made these assertions:
“For oscillations of tidal periods, the nature of the forcing is clear”
Lindzen, Richard S. “Planetary waves on beta-planes.” Mon. Wea. Rev 95.7 (1967): 441-451.
and
“5. Lunar semidiurnal tide
One rationale for studying tides is that they are motion systems for which we know the periods perfectly, and the forcing almost as well (this is certainly the case for gravitational tides). Thus, it is relatively easy to isolate tidal phenomena in the data, to calculate tidal responses in the atmosphere, and to compare the two. Briefly, conditions for comparing theory and observation are relatively ideal. Moreover, if theory is incapable of explaining observations for such a simple system, we may plausibly be concerned with our ability to explain more complicated systems.
Lunar tides are especially well suited to such studies since it is unlikely that lunar periods could be produced by anything other than the lunar tidal potential. “
Lindzen, R.S. and Hong, S.S., 1974. “Effects of mean winds and horizontal temperature gradients on solar and lunar semidiurnal tides in the atmosphere“. Journal of the atmospheric sciences, 31(5), pp.1421-1446.
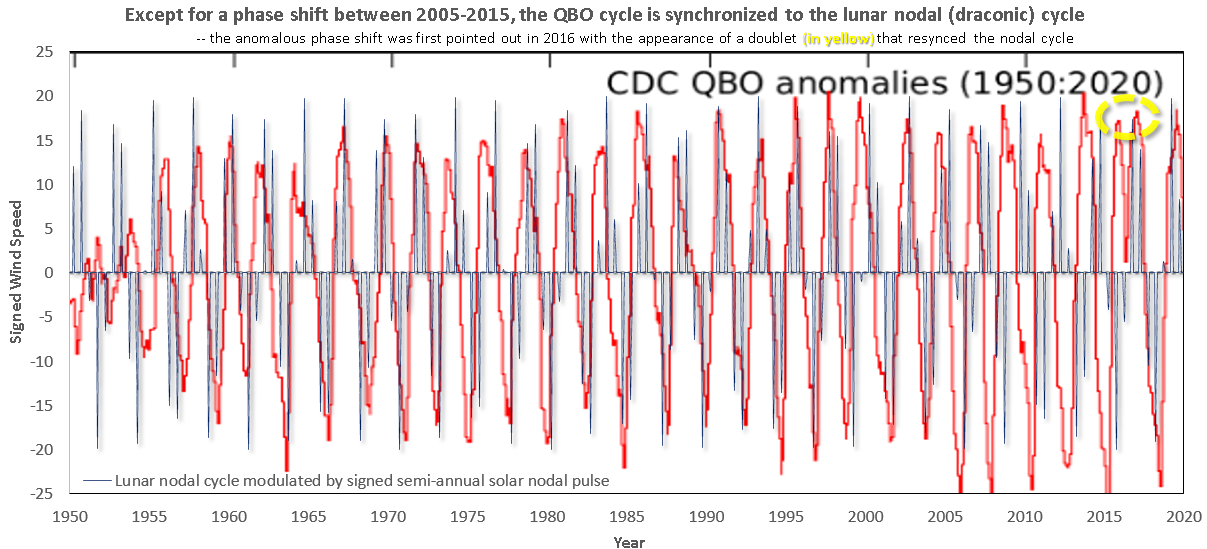
With that in mind, it should be possible to rule out the role of tidal forcing as the driving stimulus to a phenomenon such as the ~2.37-year cycle of the QBO. If the cycles of QBO and known tidal periods don’t match, then end-of-story according to Lindzen and tidal forcing isn’t and cannot be the forcing stimulus. Yet, when one checks the numbers for the longitudinally-invariant nodal tidal cycle against the annual solar nodal cycle (a strongly non-linear coupling), it comes out calibrating precisely on period:
1 / (365.242/27.2122 -13) = 2.369 years
This is simply an aliasing sideband frequency formula, easily found as a FAQ on signal processing forums. It can also be graphically checked by multiplying an annual impulse train with the tidal cycle and plotting the result, as shown below.

After providing a lagged response to filter out the impulse, the agreement to the QBO data is obviously evident as shown below (plot generated from the GEM library).

So why didn’t Lindzen see this connection 50 years ago, while it is so evidently obvious?
Being charitable, it could be because the possibility of the nonlinear interaction of an annual signal with the tidal cycle was never considered by Lindzen back then, and it has since got lost in the interim. To be non-charitable, it may be that Lindzen lacked the insight to consider what is quite commonly encountered (i.e. waveform aliasing) in other disciplines.
One aspect that has become more obvious over time is that the stronger the annual impulse, the greater the delineation of the cycle via the nonlinear modulation. A recent paper by Alexander & Vincent [1] provides evidence for a very sharp gravity wave impulse, see the narrow impulse labeled in the 2-D plot below, with empirical data collected from airborne measurements.

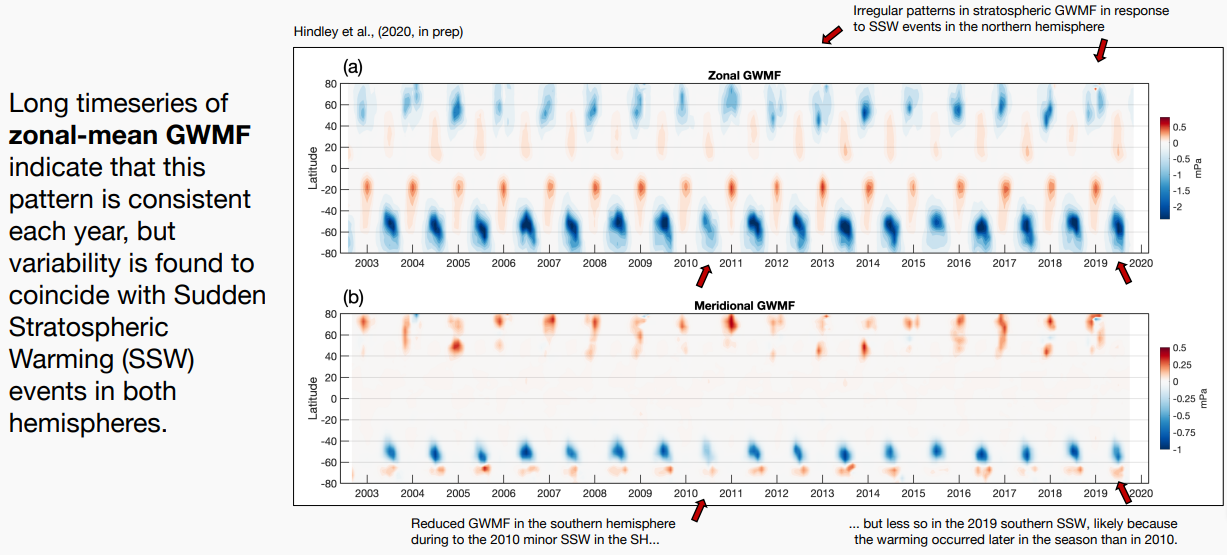
And this result in the figure below from Hindley et al presented at this year’s EGU ([2] and discussed here) clearly shows how striking the annual impulse train is.

What is somewhat perplexing about the consensus surrounding QBO is that there is some indication (i.e. unwritten understanding) that the cycle is fixed — otherwise there wouldn’t be dozens of research papers discussing the QBO anomaly/disruption of 2016 and how it transiently disrupted the cycle. In other words, how can they say there is a disruption unless the underlying cycle is well understood?
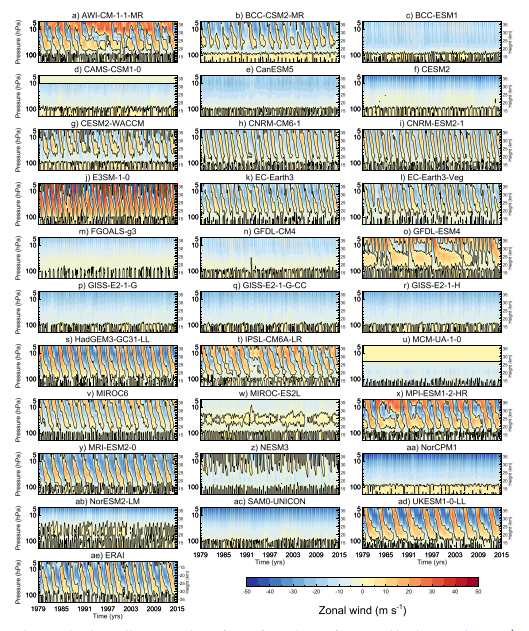
These are all attempts to model QBO, taken from this paper doi:10.1029/2019jd032362 Why all so different for such a simple behavior? Unless there is consistency, any explanation of an anomaly would have to consider each of these plots individually.

Whereas with a lunisolar forcing, only one model is required as a baseline for further understanding. That’s why Lindzen’s jumping the gun on a mechanism behind QBO was so unfortunate — as it has likely deferred advances toward a common understanding for decades. As Lindzen himself said in the quote at the top of this post, that “(without) such a simple system, we may plausibly be concerned with our ability to explain more complicated systems“.
References
1.Alexander, M. J. & Vincent, R. A. Balloon-borne observations of short vertical wavelength gravity waves and interaction with QBO winds. http://www.essoar.org/doi/10.1002/essoar.10502563.2 (2020) doi:10.1002/essoar.10502563.2.
2. Neil Hindley, Corwin Wright, Lars Hoffmann, M. Joan Alexander, Nicholas Mitchell, Exploring long-term satellite observations of global 3-D gravity wave characteristics in the stratosphere, EGU2020-19821 https://presentations.copernicus.org/EGU2020/EGU2020-19821_presentation.pdf
“On the forcings of the unusual Quasi-Biennial Oscillation structure in February 2016” — http://oceanrep.geomar.de/47636/1/acp-20-6541-2020.pdf
“horizontal Rossby wave momentum flux”
Where else but in climate science can you find a descriptive term that appears nowhere else, but this one paper? The Rossby wave momentum flux comprises the rapid gravity wave component and the horizontal applies just that.
This is at an altitude of 40 hPa, which is congrouent with the horizontal 40 hPa QBO stratospheric layer
The model fit is essentially the ENSO forcing but featuring more of the high wavenumber LTE modulation in comparison to that applied to the oceanic ENSO. This makes sense because the atmosphere has a much faster inertial response, so can accommodate the high-K solutions.
LikeLike
Pingback: El Nino Modoki | GeoEnergy Math
Lindzen Twitter thread:
Explainer:
https://forum.azimuthproject.org/discussion/comment/22425/#Comment_22425
LikeLike
https://platform.twitter.com/widgets.js
In the context of my original comment, this is an almost predictable back-and-forth discussion. As I implied, in the absence of some actual data to compare against, the mathematical degrees of freedom involved in a fluid dynamics formulation will allow many possibilities for a potential solution.
Geoscientific model development should be geared toward emulating some known physical behavior, otherwise it would be just discussion of the math underlying partial differential equations. Consider the figure below taken from https://doi.org/10.1029/2019JD032362 which collects over 30 model comparisons to a historical QBO time-series, yet revealing little consilience and limited agreement among the models. The authors of the paper suggest that even though “the number of climate or Earth system models being able to simulate the QBO” …. “However, the quality of the simulation of the QBO has not improved.”
What can end this back-and-forth discussion is the mathematical insight leading to a formulation that will allow the QBO time-series to be modeled effectively. Otherwise, in the absence of a real-world context, there is no end in sight.
LikeLike
Pingback: The Tragedy of QBO | GeoEnergy Math