Notes from the EGU 2020 meeting from last week. The following list of presentation pages are those those that I have commented on, with responses from authors or from chat sessions included. What’s useful about this kind of virtual meeting is that the exchange is concrete and there’s none of the ambiguity in paraphrasing one-on-one discussions that take place at an on-site gathering.
https://meetingorganizer.copernicus.org/EGU2020/EGU2020-12346.html
Potential state shifts in terrestrial ecosystems related to changes in El Niño-Southern Oscillation dynamics by Mateo Duque-Villegas
I pointed out in response to another commenter’s (Bruun) claim “The ENSO process is a resonant wave phenomena of the earth system “ that “The evidence doesn’t support this. It appears to be more driven by tidal forces as can be seen by calibrating against the known angular momentum changes (from dLOD) and then applying a solution to Laplace’s Tidal Equations along the equator.”
Some back and forth where Bruun said diurnal and semidiurnal tidal cycles (which are much too fast IMO to invoke a response) should “play a role”.
https://meetingorganizer.copernicus.org/EGU2020/EGU2020-21756.html
Multidecadal changes in ENSO properties in the recharge oscillator conceptual model by Lander Crespo
In the chat:

In the permanent comment, I clarified as to how a “recharge oscillator model fits into GCMs, in that it is more a simplifying model trained from the output data, so it provides a phenomenological interpretation.”
The author Crespo responded “I am glad to hear that my explanation was clarifying. I can try to expand here now with more time. As I said in the chat we train the model with CMIP5 models output data. In practice this means that we fit the recharge oscillator conceptual model to the output data of the CMIP5 models to obtain the parameters of the model (see my slides). Once we have the parameters we can run the model freely and build some statistics with the output variables of the ReOsc mode; SST and thermocline.
By doing this we can investigate if the recharge-discharge mechanism is well represented by each CMIP model, how is the amplitude of it and if there is a decadal modulation in this mechanism in the models.”
https://meetingorganizer.copernicus.org/EGU2020/EGU2020-18545.html
Constraints on the Rheology of the Earth’s Deep Mantle from Decadal Observations of the Earth’s Figure Axis and Rotation Pole by Alexandre Couhert
I asked if the Chandler Wobble may be a “434 day wobble a result of the lunar nodal torqueing cycle (13.606 day) acting on a non-spheroidal earth”
The response is “Your hypothesis indeed sounds reasonable in theory. However, in practice, on the plots of my slide 4 you can see a very good match between the C21/S21 series I derived (in blue), removing all the known tidal effects, and the Chandler polar motion evolution (in red). This shows that tidal effects cannot be the source of this ~430-day oscillation.”
Provoked another response after I posted this chart and the recent paper by Na


https://meetingorganizer.copernicus.org/EGU2020/EGU2020-11931.html
ENSO sensitivity to radiative forcing by Evgeniya Predybaylo
I mentioned that “An annual forcing is observed in the ENSO cross-spectrum with a mirror symmetry about the 0.5/yr point. It’s referred to as double-sideband suppressed-carrier modulation“
One of the authors (Stenchikov) responded “I am not sure I understand it correctly. Volcanic forcing is sporadic and the system is nonlinear. So you should see multiple subharmonics generated.”
A subharmonic would be a lower (i.e. half) frequency but he may have meant higher. Assuming that, I countered with a recent chart showing the mirror symmetry at higher (super) harmonics but no further response

In the chat session, I asked a question as follows but no response, as they ran out of time apparently.

The author did answer Bruun’s question though: “Evgeniya Predybaylo KAUST/MPIC (07:13) @John Bruun Exeter Well, according to our simulations, the tropical Pacific response can show the variety of responses – from La Nina-like to El Nino-like depending on what was the state of the Pacific during the eruption. So, the effect is actually significant. “

The Pacific Ocean dynamics seems to be immune from volcanic forcing, so the response is questionable at best.
https://meetingorganizer.copernicus.org/EGU2020/EGU2020-17743.html
ENSO and TWC: a multi-model evaluation by Valentina Pivotti
I tried asking during the chat session and on the presentation linked above but got no reply in either case:


https://meetingorganizer.copernicus.org/EGU2020/EGU2020-19240.html
Study of the Earth rheological properties from polar motion by Christian Bizouard
I asked “Why isn’t the 434 day wobble a result of the lunar nodal torqueing cycle (13.606 day) acting on a non-spheroidal earth? “
A very detailed answer from Bizouard: “According to our present understanding, the 434 day wobble is a normal mode of the Earth rotation, produced by the Earth flattening (the Euler mode with a period of 304 days). The departure of the 434 period from the Euler period predicted for a rigid Earth results from the Earth deformation (the pole tide), produced by the tiny centrifugical variation accompagnying the polar motion. Effect of the Moon has never been proved, even if some authors invoke a possible synchronisation of the Chandler wobble with tidal cycles through non-linear processes, that has to be demonstrated. Dissipation accompaniying the pole tide results in a decay of the Chandler wobble: after 200 years its amplitude would be divided by 8-100 in abscence of excitation. So, its maintenance, at an amplitude of 50-200 mas, requires a forcing. According to my own studies, that one stems from atmospheric and oceanic mass transports.”
I responded at some length starting with “The expected value is 365.242/(365.242/13.606-26) = 433 days, which matches the established value of the Chandler wobble cycle. …. “
This response:

BTW, the author Bizouard is the Director of the EOP (Earth Orientation Parameters) Product Center at http://obspm.fr which is the observatory in Paris that keeps track of the earth’s rotation parameters, see http://hpiers.obspm.fr/eop-pc/index.php. So it’s good to get a response with such conviction.
https://meetingorganizer.copernicus.org/EGU2020/EGU2020-13127.html
Length of day fluctuations at long and short timescales. Geomagnetic drivers by Crisan Demetrescu
This presentation discusses the 6-year cycle in dLOD so I asked this question “Since the dLOD is dominated by variations caused by tidal/gravitational forcing, why isn’t the 6-year cycle traced to the interaction between the nodal (18.6y) and perigean (8.85y) cycle?“
The author responded “It was shown by Gillet et al. (2010) that the 6-year varaition in LOD can be linked to variations in the geomagnetic field produced in the Earth’s fluid outer core by Alfven waves and torssional oscillations of the appropriate period. We do not reject the possibility that two lunar cycles contribute as well. Thanks.”
I countered with good on being able to extract the signal because it is quite weak in my opinion. As I mentioned, the 18.6 year cycle is very apparent in dLOD but I have had hit-or-miss success in trying to isolate it definitively.
https://meetingorganizer.copernicus.org/EGU2020/EGU2020-7088.html
Climate impact on Earth rotation speed from CMIP6 model simulations by Sigrid Böhm
I commented as follows: “The changes in the LOD or angular momentum will likely be felt most strongly in the ocean’s thermocline, where the highly reduced effective gravity at the thermocline density interface is most suceptible to inertial changes. And since dLOD is largely governed by tidal forcing cycles, the thermocline sloshing will transitively be accounted for by the tidal pattern. This has recently been shown to be the case with ENSO, see Lin, J. & Qian, T. Switch Between El Nino and La Nina is Caused by Subsurface Ocean Waves Likely Driven by Lunar Tidal Forcing. Sci Rep 9, 1–10 (2019).”
The author responded: “Thank you for the interesting comment! We will have a look at the article.”
https://meetingorganizer.copernicus.org/EGU2020/EGU2020-19806.html
The dynamical composition of the Madden-Julian oscillation by José M. Castanheira
Based on a comment in their presentation that MJO is “yet poorly simulated in most atmospheric circulation models”, I commented : “Is that because it’s not well known that it is connected directly to ENSO via the SOI measure with a 21-day lag?”
The author responded : “What index do you use for the MJO?
Did you try to calculate the correlation with the interannual variability removed?”
I answered that here in CC4, showing the cross-correlation chart at short (much less than interannual) time intervals.
The author concluded with an answer to someone else’s question: “In think the energy source for Rossby waves is the organized convection trough atmospheric column stretching. Citing Geoffrey K. Vallis (pag. 326, 2017) ”From the perspective of potential vorticity, then to the extent that the flow is adiabatic the quantity (𝑓 + 𝜁)/ℎ is conserved following the flow. The heating increases the value of ℎ (the stretching), so that 𝑓 + 𝜁 also tends to increase in magnitude. The flow finds it easier to migrate polewards to increase its value of 𝑓 than to increase its relative vorticity alone, for the latter would require more energy.” Then a pair of cyclonic centers is formed straddling the equator.”
That may be how the MJO spins off the equator as a wave-train, transforming the standing waves of ENSO into the vortex-like equatorial traveling Tropical Instability Waves and then peeling those off as the off-equatorial MJO waves. This is all a lunisolar energy source though, imho.
https://meetingorganizer.copernicus.org/EGU2020/EGU2020-17014.html
Observed seasonality in internal wave energy and associated mixing in a temperate shelf sea by Juliane Wihsgot
I asked whether “these cycles due to synodic tides?”
The author answered “The 14 day variation that you mention is the spring-neap cycle. That is caused by the interaction of the two semi-diurnal constituents, M2 and S2”
True, and when an inertial response is factored in, then the 14 day cycle is what impacts behaviors such as dLOD and ENSO.
https://meetingorganizer.copernicus.org/EGU2020/EGU2020-6394.html
Diversity of the Madden-Julian Oscillation by Guosen Chen
I asked : “Why do the SOI and MJO track each other so closely but with lag of 21 days separating them?”
The author responded :
“What kind of MJO time series do you use? Is it RMM index or something like that?
As the MJO convection propagates from equatorial Indian Ocean to equatorial Pacific, it may cause SLP variations that resemble the SO. Therefore, the correlation between MJO and SOI could be a reflection of the influence of SLP variation by the MJO. The time lag between them is probably due to the time lag between the positve phase describe by the MJO time series you used and the MJO phase that cause SO-like SLP pattern.
I don’t think MJO is a slave to ENSO. “
I responded with a link to the pentad MJO source at NOAA but that was essentially the last comment so far. They have a journal article here:
Chen, G. & Wang, B. Circulation factors determining the propagation speed of the Madden-Julian Oscillation. Journal of Climate (2020).
https://meetingorganizer.copernicus.org/EGU2020/EGU2020-8885.html
Seasonal prediction of the austral summer Southern Annular Mode, and investigation of its connection to the Southern Ocean by Tim Hempel
I pointed out that the SAM index may share a common forcing with ENSO. Provided a reference to Mathematical Geoenergy
“Thanks, will have a look.”
Also tried a link but that did not go through.
https://meetingorganizer.copernicus.org/EGU2020/EGU2020-13481.html
Nonlinear time series models for the North Atlantic Oscillation by Abdel Hannachi
I mentioned the common-mode lunisolar forcing between NAO and other climate indices and received this response:
“Thanks Paul for this interesting comment!
We did not look at the spectra of the NAO, we msotly looked at the time domain focussing on the nonlinear aspect of predictability. The lunisolar forcing seems to be all over (NAO, Arctic Oscillation, plant growth …). which frequency precisely you are talking about – From the figure you posted, you seem to tal about quite low frequency, righ!
/Abdel”
Yes, indeed. He later requested our most recent AGU paper.
https://meetingorganizer.copernicus.org/EGU2020/EGU2020-7171.html
Troposphere-Stratosphere Coupling In S2S Models and Its Importance for a Realistic Extratropical Response to the Madden-Julian Oscillation by Chen Schwartz
I asked “why is it that ENSO has such a strong correlation to MJO when a 21 day lag is applied?”
Read the full conversation but part of the response by Chen Schwartz:
The fluctuations in the SOI index that are correlated with the MJO could be possibly, in part, related to the surface westerly anomalies induced by the MJO, but this is something I’ve never looked on (the ENSO signal is usually has to be separated from the MJO).
The connection to El-Nino events is more complex as far as I know, and it’s on timescales longer than 3 weeks.
responded with a suggestion about MJO being a traveling wave offshoot of ENSO but this was the extent
“As far as I know, ENSO can modulate the MJO and also its extratropical response, but it does not trigger it (their timescales are not the same). Nevertheless, tropical meteorology is not my expertise, so you may want to attend the Tropical Meteorology session tomorrow, so you can get more in-depth answers. “
This insight is much better than nothing!
https://meetingorganizer.copernicus.org/EGU2020/EGU2020-20845.html
Learning Lyapunov stable Dynamical Embeddings of Geophysical Dynamic by Said Ouala
I asked : “How can one extract a description of the differential equation when the forcing is unknown?”
response
“I believe that when the forcing overrides the natural response of a system, the extracted model naturally (due to the learning criterion) relates the forcing signature to the dynamics and thus, approximates the forced system with a non-foreced one. This approximation may be crude but one can add a learnable forcing signatures (similarly to what we did with the learnable embedding) to find an approximate forced system. However, without any prior knowledge of either the dynamics or the forcing, the latter approximation will not be quite informative since forcing signatures will mixed with the natural dynamics of the system.”
That’s a good response. I added “Both the initial conditions (as you say) and the running boundary values as either ongoing temporal forcing or spatial boundary conditions play a role. Thank you.”
https://meetingorganizer.copernicus.org/EGU2020/EGU2020-7569.html
Boosting performance in Machine Learning of Turbulent and Geophysical Flows via scale separation by Davide Faranda
I wanted to point out that flows in their reference “global sea-level pressure data for the past 40 years” may not be chaotic: “The longest continuous sea-level pressure (SLR) time series may be the SOI differential between Tahiti and Darwin which characterizes ENSO. This is not chaotic as it arises directly from tidal forcing patterns, which are similar to the pattern found in the earth’s length-of-day variations but modulated by the ocean’s fluid dynamic response.”
No response so far. Good figures though and some good insight into where machine learning will have problems when they assume a chaotic solution. Note the value of being able to solve Navier-Stokes as we can with the LTE approach.

- It is not straightforward to apply Machine Learning techniques to geophysical flows: turbulence and intermittency worsen the performance
- Partial predictability can be recovered by separating large from small scale dynamics (e.g moving average, PCA, wavelets)
- Possible developments will largely benefit from interactions with the stochastic dynamical systems community
https://meetingorganizer.copernicus.org/EGU2020/EGU2020-2113.html
Improving the forecast skill of El Nino diversity: A nonlinear forcing singular vector approach by Lingjiang Tao
Quite the complex model so I posed a simple question: “Is switching between El Nino and La Nina caused by subsurface ocean waves driven by lunar tidal forcing ?”
Response:
“No. the tidal forcing may influence the switching but not the major reason. The transition between El Nino and La Nina can be explained by the theories of the delayed oscillation, charge-dischage …. The easterward subsurface ocean waves (i.e., kevin waves) are due to the beta-plane.”
So apparently from the GCMs they are creating an “intermediate complex model (ICM) and makes the ICM output closer to the observations”.
In the presentation, they mention that the ICM is unable to model Tropical Instability Waves (TIW). Their longer paper here: https://journals.ametsoc.org/doi/full/10.1175/WAF-D-19-0050.1
https://meetingorganizer.copernicus.org/EGU2020/EGU2020-2235.html
A Linear Inverse Model of Tropical and South Pacific Seasonal Predictability by Jiale Lou
They are tying to find commonality between Pacific ocean climate indices.
Asked this loaded question but no response: “Are these teleconnections or are they actually related by a common-mode mechanism, such as the erratic nature of long-period tidal cycles?”
RESPONSE 5/20/2020 – “It is a interesting question, but tide changes are not the focus of our research.”
https://meetingorganizer.copernicus.org/EGU2020/EGU2020-2560.html
The behavior of Gravity wave during the unusual QBO structure in 2015/2016 by Haiyan Li
I added an observation based on the latest QBO data “It has been a few years since the 2015-2016 QBO anomaly and the QBO cycle has re-aligned to the predicted lunisolar-nodal cycle of 28.436 months. This is the expected wave response from the gravitational forcing.”
Surprised by the response:
“Thank you. This is a good perspective. And how much variance contribution the 28 month periodicity of QBO can explain may also affect its predictability.”
They think there was a higher energy density feeding the gravity wave during the 2015-2016 time frame. Compare against our model of QBO. This may have transitioned first around 2006 and ended in 2016.

https://meetingorganizer.copernicus.org/EGU2020/EGU2020-16682.html
The QBO as driver of lower stratospheric ozone variability as quantified in the CCM SOCOLv3 by Andrea Stenke

Offered this comment “This might help in understanding QBO — consider the forcing the lunisolar nodal cycle interacting with the topology of the equatorial toroid generates the corrects period” but no response.
https://meetingorganizer.copernicus.org/EGU2020/EGU2020-15897.html
The influence of the tropical troposphere on the QBO in model simulations by Federico Serva

Offered a similar comment “There is no real snchronization between the QBO and ENSO since QBO has a wavenumber of 0 implying only tidal forces of hemispherical symmetry will be involved, such as the lunar and solar nodal tide. On the other hand, since ENSO is a tropical Pacific with non-zero longitudinal wavenumber, the lunar tropical/synodic tide provides the greater forcing.” but also no response.
https://meetingorganizer.copernicus.org/EGU2020/EGU2020-5635.html
An evaluation of tropical waves and wave forcing of the QBO in the QBOi models by Laura Holt
Another commenter asked this:
“MIROC-AGCM-LL does have realistic QBO without gravity wave prameterization. Does it imply GW drag is not necessary in simulaiting QBO?”
I responded “How can QBO not require gravity wave parameterization? The QBO cycle of 28 months is clearly an exact alignment with the lunar nodal gravitational cycle. This is such a strong synchronizing force that even the QBO anomaly of 2015-2016 couldn’t permanently disrupt the alignment, as it is now has synched back to the prior cycle.” but that’s as far as the discussion went.
https://meetingorganizer.copernicus.org/EGU2020/EGU2020-17338.html
Evaluation of the Quasi-Biennial Oscillation in global climate models for the SPARC QBO-initiative by Andrew Bushell
No response to this comment: “Have you been aware that the 28-month QBO cycle has been verified to be aligned to the atmospheric lunar nodal tide? This was cross-validated when after the 2015-2016 QBO anomaly, the alignment re-established itself, much like tidal signals will re-align after a tsunami.”
https://meetingorganizer.copernicus.org/EGU2020/EGU2020-8789.html
Lidar Observations of Seasonal Variability of Gravity-Waves by Irina Strelnikova
During the chat session I asked:

This makes sense as at the polar latitudes (northern Norway is the focus of this study), a seasonal signal will be strongest, while the equator will show a semiannual oscillation for each nodal crossing.
https://meetingorganizer.copernicus.org/EGU2020/EGU2020-6118.html
Middle-Atmosphere Mountain Waves and Drag Near the Drake Passage: Observations, mini-MIP, and an OSSE by Christopher Kruse
My chat session comment:

his response

https://meetingorganizer.copernicus.org/EGU2020/EGU2020-8503.html
Internal tides / lee waves coupling : dynamics and impact on the ocean energy budget by Yvan Dossmann
Chat session question that was promptly answered

In many of the papers on internal tide generation, the waves arise from interactions from tides with abyssal hills and ridges, so it is interesting to learn that the thermocline interface can also spawn the waves. The soliton response is intriguing since I made the connection between traveling waves and solitons on a recent MJO post. BTW, they don’t say anything about the thermocline in their presentation. The Drake passage also mentioned.
I added the Qian & Lin reference for good measure to the chat.
https://meetingorganizer.copernicus.org/EGU2020/EGU2020-8371.html
A Parametrization for Triad Interactions of Internal Gravity Waves in Varying Background Flows for WKBJ Ray-Tracing Methods by Georg Sebastian Voelker
Added a comment during the chat session:


This triad feature shows up frequently as I discussed in a recent blog post titled Triad Waves, where I mention the work of Bruce Sutherland.
There was a related presentation on experimental work : The long-time spatial and temporal development of Triadic Resonance Instability which has flow along diagonal beams

Reminding of these Sutherland waveforms that occur in stratified layers and that we can reproduce

https://meetingorganizer.copernicus.org/EGU2020/EGU2020-7375.html
A multi-wave model for the Quasi-Biennial Oscillation: Plumb’s model extended by Pierre Léard
A comment during the chat session on internal gravity waves (IGW):


added a comment to the presentation page: “I never understood the rationale for the Plumb experiment to act as a validation for the QBO mechanism. First of all, the Plumb apparatus is a rotating cylinder and not a rotating sphere, so it does not allow the apparently important Coriolis effect. Secondly, the lab-sized nature of the apparatus prevents the emulation of any gravitational effect. There are centrifugal acceleration aspects but these aren’t balanced by gravity, and what’s more, any gravitational effects are along the length of the cylinder and not radial. Overall and at best, it may help explain certain stratification properties, but validates nothing about the fundamental QBO oscillation.“
https://meetingorganizer.copernicus.org/EGU2020/EGU2020-9374.html
Transition from geostrophic flows to
inertia-gravity waves in the spectrum of a
differentially heated rotating annulus experiment by Costanza Rodda
I added a comment to the chat session, but it was at the end so never got addressed:

Interesting chart here from their uploaded presentation:

In Chapter 11 of our book on wind energy, we model the Nastrom and Gage data via a damped correlation model for a peaked wavenumber with figure reproduced below. The piece-wise power-law roll-off shown above is replaced by a smooth continuum with inflection points determined by the specific shape of the Cauchy density function.

May write a longer post on this because it does address the concept of dispersion in the context of wave spectrum that also shows distinctly more likely (i.e. peaked) wavenumbers.
Asked about this on the comment page
https://meetingorganizer.copernicus.org/EGU2020/EGU2020-8835.html
Walker Circulation controls ENSO Atmospheric Feedbacks in Uncoupled and Coupled Climate Model Simulations by Tobias Bay
Asked a question during the chat session

No response.
https://meetingorganizer.copernicus.org/EGU2020/EGU2020-7527.html
A new perspective on studying ENSO teleconnections by Matyas Herein
During the chat, asked a question about the spring barrier:

https://meetingorganizer.copernicus.org/EGU2020/EGU2020-7263.html
A weather system perspective on winter-spring rainfall variability in southeastern Australia during El Niño by Seraphine Hauser
Since this concerned Australia, asked a question about IOD:

The IOD has a common-mode connection to ENSO shown here, based on the standing-wave mode.
https://meetingorganizer.copernicus.org/EGU2020/EGU2020-16656.html
Revisiting ENSO Atmospheric Teleconnections and Challenges by Andréa S. Taschetto

How can they determine what ENSO does in a warming world if they don’t understand the fundamentals behind ENSO? Asked in a chat session


https://meetingorganizer.copernicus.org/EGU2020/EGU2020-8916.html
Future changes in ENSO teleconnections over the North Pacific and North America in CMIP6 simulations by Jonathan Beverley
In chat session:


At the end of this session, someone took a potshot at me


https://meetingorganizer.copernicus.org/EGU2020/EGU2020-6137.html
Nonlinear components in global climate teleconnections by Jiří Mikšovský
“Nonlinearities prominent in some setups, but vary strongly with location or season of the year”
In the chat on a session devoted to primarily paleoclimate topics :


FOOTNOTES
- I am pukpr in the chat sessions
- The chat sessions averaged >100 participants from what I heard but were not archived.
- The uploaded presentations have relatively few comments attached so far but are permanent. New comments will be accepted until May 31
- This virtual conference was instead of the yearly meeting in Vienna. I debated submitting an abstract but didn’t.
- Will add more in the comments below
CC1: Comment on EGU2020-9374, Paul Pukite, 10 May 2020 Reply
Added a response
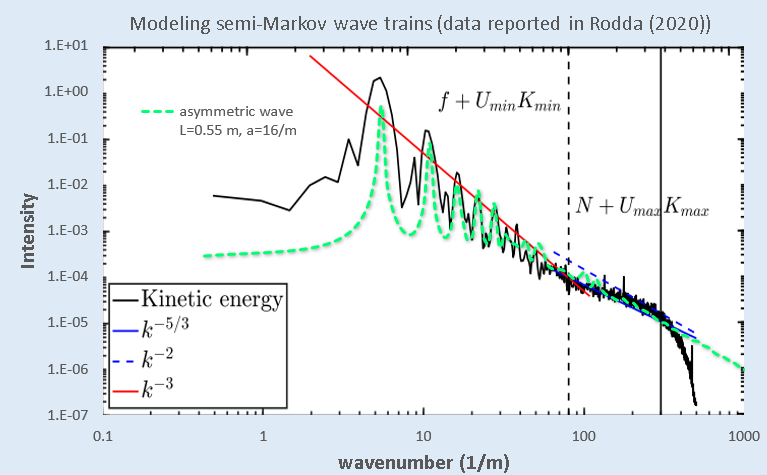
“Another suggestion is to model the spectrum in your slide 7 more realistically. There is clearly a strong periodic component in the wavetrain data. This is my attempt at extracting what appears to be a semi-random sawtooth wave from the spectra (the method is described in my book Mathematical Geoenergy). The point is that the more you can characterize the data the better that you can extract and discriminate the finer structure that you are interested in — in your case the high wavenumber turbulence”
Pingback: Characterizing Wavetrains | GeoEnergy Math
https://meetingorganizer.copernicus.org/EGU2020/EGU2020-6118.html
more comments on “Middle-Atmosphere Mountain Waves and Drag Near the Drake Passage: Observations, mini-MIP, and an OSSE”
Regarding the Drake Passage, Woodworth and Hibbert were able to extract the long-period tidal forcing from bottom-pressure readings. These long-period tides can then be used to calibrate the forcings used to drive ENSO and other climate dipole cycles.
This chart shows thecomposite tidal cycle used in the model compared against the Drake Passage.
ydikro
Since tidals are global and show only amplitude and phase differences between locations, this forcing can be used to drive the ENSO behavior via the nonlinear LTE solution
1vvhpo
See this blog post for other citations and charts: https://geoenergymath.com/2019/02/25/long-period-tides/
“Exploring long-term satellite observations of global 3-D gravity wave characteristics in the stratosphere”
https://meetingorganizer.copernicus.org/EGU2020/EGU2020-19821.html
“Orographic sources of westward GW momentum are welldefined in both hemispheres, but the southern Andes dominates the global picture due to the stronger winds in the southern polar vortex.” — SEE Drake Passage
my comment:
also commented here https://meetingorganizer.copernicus.org/EGU2020/EGU2020-12918.html
“First airborne gravity wave observations at the world’s hotspot in Southern Argentina”
per the Yvan Dossman presentation, I added this comment to their paper:
added a comment to
“A new parameterization of gravity waves for atmospheric circulation models based on the radiative transfer equation”
https://meetingorganizer.copernicus.org/EGU2020/EGU2020-20262.html
This is the way to work with data
I think this comment by Christian Bizouard above has to be the most telling of all:
Point #1 : Nothing in physics can be ultimately “proven”, as we (at best ) can only try to match reality.
Point #2 : This can never be physically demonstrated through a lab experiment, as gravitational effects can’t be duplicated on a lab scale. However, the demonstration can be done through matching of known forcing cycles to the observed wobble.
Pingback: Why couldn’t Lindzen figure out QBO? | GeoEnergy Math