Sea-level height has several scales. At the daily scale it represents the well-known lunisolar tidal cycle. At a multi-decadal, long-term scale it represents behaviors such as global warming. In between these two scales is what often appears to be noisy fluctuations to the untrained eye. Yet it’s fairly well-accepted [1] that much of this fluctuation is due to the side-effects of alternating La Nina and El Nino cycles (aka ENSO, the El Nino Southern Oscillation), as represented by measures such as NINO34 and SOI.
To see how startingly aligned this mapping is, consider the SLH readings from Ft. Denison in Sydney Harbor. The interval from 1980 to 2012 is shown below, along with a fit used recently to model ENSO.

(click to expand chart)
I chose a shorter interval to somewhat isolate the trend from a secular sea-level rise due to AGW. The last point is 2012 because tide gauge data collection ended then.
As cross-validation, this fit is extrapolated backwards to show how it matches the historic SOI cycles

Much of the fine structure aligns well, indicating that intrinsically the dynamics behind sea-level-height at this scale are due to ENSO changes, associated with the inverted barometer effect. The SOI is essentially the pressure differential between Darwin and Tahiti, so the prevailing atmospheric pressure occurring during varying ENSO conditions follows the rising or lowering Sydney Harbor sea-level in a synchronized fashion. The change is 1 cm for a 1 mBar change in pressure, so that with the SOI extremes showing 14 mBar variation at the Darwin location, this accounts for a 14 cm change in sea-level, roughly matching that shown in the first chart. Note that being a differential measurement, SOI does not suffer from long-term secular changes in trend.
Yet, the unsaid implication in all this is that not only are the daily variations in SLH due to lunar and solar cyclic tidal forces, but so are these monthly to decadal variations. The longstanding impediment is that oceanographers have not been able to solve Laplace’s Tidal Equations that reflected the non-linear character of the ocean’s response to the long-period lunisolar forcing. Once that’s been analytically demonstrated, we can observe that both SLH and ENSO share essentially identical lunisolar forcing (see chart below), arising from that same common-mode linked mechanism.

Many geographically located tidal gauge readings are available from the Permanent Service for Mean Sea Level (PSMSL) repository so I can imagine much can be done to improve the characterization of ENSO via SLH readings.
REFERENCES
[1] F. Zou, R. Tenzer, H. S. Fok, G. Meng and Q. Zhao, “The Sea-Level Changes in Hong Kong From Tide-Gauge Records and Remote Sensing Observations Over the Last Seven Decades,” in IEEE Journal of Selected Topics in Applied Earth Observations and Remote Sensing, vol. 14, pp. 6777-6791, 2021, doi: 10.1109/JSTARS.2021.3087263.
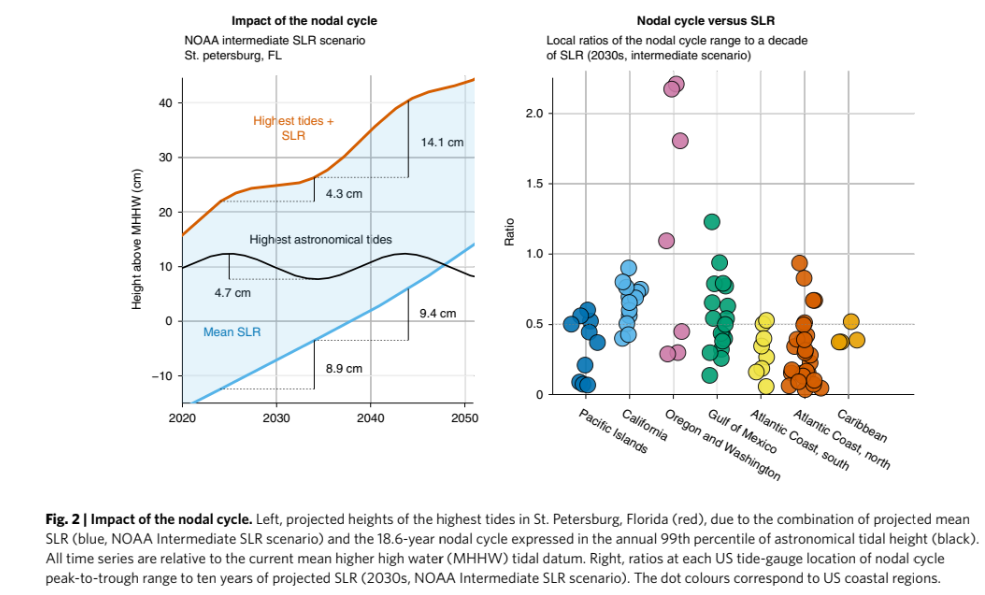
Note that the 18.6 year tidal cycle is conspicuously absent from the discussion. ENSO is non-linear so that this cycle is obscured by all else that is happening wrt lunar cycles. This could have an impact in areas not as influenced by ENSO.
Articles on the moon’s wobble:
https://www.nasa.gov/feature/jpl/study-projects-a-surge-in-coastal-flooding-starting-in-2030s/
https://www.nbcnews.com/science/environment/moons-natural-wobble-alters-earths-tides-climate-change-bad-news-rcna1431
https://www.cbsnews.com/news/nasa-moon-wobble-orbit-record-flooding-earth-sea-level-rise-climate-change/
https://www.livescience.com/high-tide-flooding-climate-change-2030
https://news.yahoo.com/moons-natural-wobble-alters-earths-213208868.html
From Nature Climate Change paper https://doi.org/10.1038/s41558-021-01077-8

LikeLike
Long-Term Dataset of Tidal Residuals in New South Wales, Australia
https://www.mdpi.com/2306-5729/6/10/101/htm
Continuous water level records are required to detect long-term trends and analyse the climatological mechanisms responsible for extreme events. This paper compiles nine ocean water level records from gauges located along the New South Wales (NSW) coast of Australia. These gauges represent the longest and most complete records of hourly—and in five cases 15-min—water level data for this region. The datasets were adjusted to the vertical Australian Height Datum (AHD) and had the rainfall-related peaks removed from the records. The Unified Tidal Analysis and Prediction (Utide) model was subsequently used to predict tides for datasets with at least 25 years of records to obtain the associated tidal residuals. Finally, we provide a series of examples of how this dataset can be used to analyse trends in tidal anomalies as well as extreme events and their causal processes.
Determining Extreme Still Water Levels for Design and Planning Purposes Incorporating Sea Level Rise: Sydney, Australia
https://www.mdpi.com/2073-4433/13/1/95/htm
LikeLike
https://www.mdpi.com/1439994
Determining Extreme Still Water Levels for Design and Planning Purposes Incorporating Sea Level Rise: Sydney, Australia
PJ Watson – Atmosphere, 2022 – mdpi.com
… water, through to even longer timescale influences including climate modes (such as ENSO, PDO, IOD, etc.) superimposed on predicable … with the lunar day being 24 h and 50 min; thus, by setting the declustering limit between peaks to at least 25 h, successive tidal peaks will
LikeLike
Fremantle, Australia
data:
https://www.psmsl.org/data/obtaining/stations/111.php
https://www.psmsl.org/data/obtaining/rlr.monthly.data/111.rlrdata
LikeLike