Appendix E of the book contains information on compartmental models, of which resource depletion models, contagion growth models, drug delivery models, and population growth models belong to.
 One compartmental population growth model, that specified by the Lotka-Volterra-type predator-prey equations, can be manipulated to match a cyclic wildlife population in a fashion approximating that of observations. The cyclic variation is typically explained as a nonlinear resonance period arising from the competition between the predators and their prey. However, a more realistic model may take into account seasonal and climate variations that control populations directly. The following is a recent paper by wildlife ecologist H. L. Archibald who has long been working on the thesis that seasonal/tidal cycles play a role (one paper that he wrote on the topic dates back to 1977! ).
Archibald, H. L. Relating the 4-year lemming ( Lemmus spp. and Dicrostonyx spp.) population cycle to a 3.8-year lunar cycle and ENSO. Can. J. Zool. 97, 1054–1063 (2019).
These are his main figures:


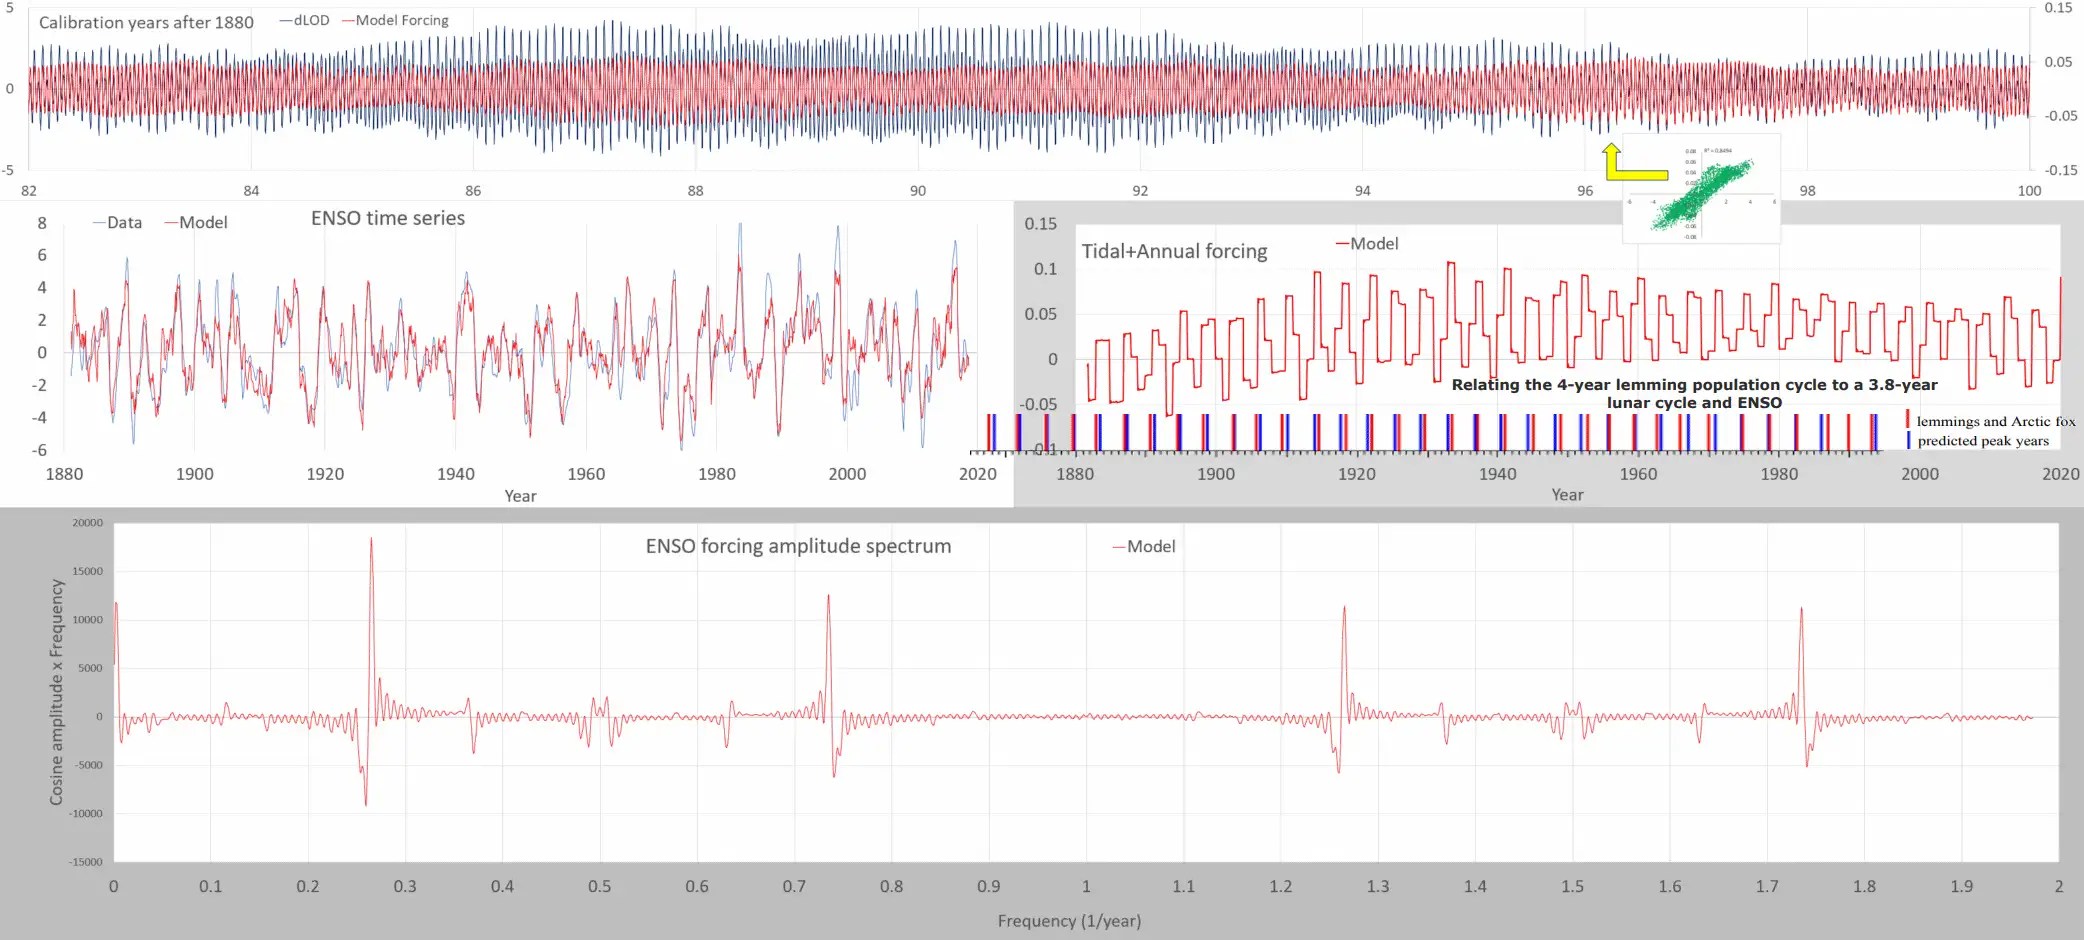
This 3.8 year cycle directly agrees with the ENSO model driven by the fortnightly tropical cycle (13.66 days) interacting with an annual cycle, which is indicated in the middle right pane in the figure below:
This image has been resized to fit in the page. Click to enlarge.
Below is an expanded view of the tidal forcing used in the climate index model in comparison to the peak years in lemming population. The tidal forcing meandering square wave aligns with the cyclic peak lemming populations. The 3.8 year cycle derives directly from the aliased beat cycle 1/(27-365.242/13.6608) = 3.794 years. The dotted lines are a guide to the eye

This image has been resized to fit in the page. Click to enlarge.
This does not validate the ENSO model but like the cyclic anchovy and sardine populations off the coast of Peru and Chile, it substantiates the view that climate variations impact wildlife populations. What the Lemming/Arctic Fox cycle does is show the ENSO-to-lunisolar-forcing connection more directly. In other words, the lemming population may be more sensitive to the precursor tidal forcing than to the resulting (and more erratic) ENSO cycles. Archibald discusses this aspect:
“One big question raised but not answered by this study: Is the ENSO cycle driven by or somehow connected with the 3.8-year lunar cycle? The correlation between predicted lemming/Arctic fox peak years and January-March SOI peak years (Table 1) suggests that ENSO might be driven by the 3.8-year lunar cycle. Zhang (2001) surmised, “There must exist some behind and deep mechanism of linking rodent outbreaks and ENSO together”. However, there is not much evidence for such a linkage. The only reference found to a relationship between a 3.8-year lunar cycle and atmospheric circulation is Wilson’s (2012) finding of a significant 3.78-year (+- 0.06) periodicity in the peak latitude anomaly of the subtropical high-pressure ridge over eastern Australia from 1860 to 2010. However, some worldwide climate oscillations contain a periodicity of ~3.8 years (selected examples in Table 4), and it is clear that these oscillations are interconnected. For example, Li and Lau (2012) examined the late winter teleconnection between the ENSO and the NAO and found that the average NAO index values in 19 El Niño winters and 20 La Niña winters were -0.35 and 0.51, respectively: positive NAO index values are more frequent during La Niña winters, and negative winter NAO index values are more frequent during El Niño events.”
Archibald (2019)
The solution to the Laplace Tidal Equations provide the direct linkage from 3.8 years to the observed ENSO pattern. The 3.8 year pattern remains embedded in this pattern along with the nonlinear superharmonics that are generated from the forcing input.
Will leave this recent citation here:
This may help explain why the LTE wave solution aligned precisely along the equator sustains a standing wave mode with characteristic Mach-Zehnder superharmonics. A Google Scholar search for “superharmonic cascade” only gives 4 hits.
In contrast, the number of hits for “subharmonic cascade” is like 334.
Without context, a harmonic is typically a superharmonic as creating multiples of a frequency is easier than creating a fraction of a frequency level, the latter being a subharmonic.
https://scholar.google.com/scholar?q=%22subharmonic+cascade%22
In a sense, a superharmonic cascade is the same as creating overtones or simply generating harmonics, which is simple to do.
Lemmings must be a critical research topic as this article has 42 authors
Ehrich, D., Schmidt, N.M., Gauthier, G. et al. Documenting lemming population change in the Arctic: Can we detect trends?. Ambio 49, 786–800 (2020). https://doi.org/10.1007/s13280-019-01198-7
Regarding the superharmonics paper of Baker and Sutherland, another by Sutherland and Jefferson
https://twitter.com/WHUT/status/1246849354402598912
When they talk of a triad it is a triplet of waves such that the wave-numbers add up as such : k = k_a + k_b
https://www.wolframalpha.com/input/?i=plot+sin%2827t%29+%2Bsin%2830t%29+%2B+cos%283t%29
This could be a pair of rapidly oscillating TIW waves with a beat frequency difference that equals the main ENSO dipole. This may have the advantage of emulating the behavior of TIW waves such that they are really only apparent during the La Nina phase!
IOW, during El Nino the beat of the TIW pair cancels
Triad LTE modulation:
https://imagizer.imageshack.com/img924/8574/NRBjd1.gif
Pingback: Triad Waves | GeoEnergy Math
https://www.researchgate.net/publication/285994132_The_enigma_of_the_10-year_wildlife_population_cycle_solved_Evidence_that_the_periodicity_and_regularity_of_the_cycle_are_driven_by_a_lunar_zeitgeber
Herb,
That 9.3 and 18.6 cycle is impressive for the the years displayed. I couldn’t add anything more to it if you are thinking that it’s mainly related to the well-known moonlight cycle based on lunar declination that you describe in the paper. It’s a slight effect in terms of absolute declination but it may make a difference considering how predator & prey nocturnal eyesight has evolved.
The other ~4 year cycle may be more related to climate cycles, set according to how lunar tides interact with the annual cycle.
https://forums.space.com/threads/what-is-the-moon%E2%80%99s-effect-on-the-earth.31811/
Consider the aliasing between the annual cycle and the primary lunar tidal cycles. The aliasing for the tropical fortnightly cycle of 13.66 days gives ~3.8 years and the aliasing for the anomalistic monthly cycle of 27.55 days results in ~3.9 years. The idea here is that the annual reproduction of either lemmings or of their prey, the Arctic fox, is timed to synchronize to a lunar extreme — either a point in the sky for the tropical (synodic) fortnightly cycle or the apparent size of the moon for the anomalistic (perigean) cycle. Since the timing will jump around from year-to-year, it might be expected that the lemming litter (or fox litter) may have less of a chance of survival if the timing occurs too early in a year. Thus it may result in the cycling of the populations, which has traditionally thought to be caused instead by non-linear predator-prey dynamics (i.e. the Lotka-Volterra equation).
BTW, Herb has been working on this topic since the 1970’s and may finally have found the basis for the mysterious cycle.
Human
https://advances.sciencemag.org/content/7/5/eabe1358?intcmp=trendmd-adv
https://advances.sciencemag.org/content/advances/7/5/eabe1358/F1.large.jpg
Human sleep
https://advances.sciencemag.org/content/7/5/eabe0465?from=article_link
https://science.sciencemag.org/content/371/6528/477.6.extract.jpg
Timing of population peaks of Norway lemming in relation to atmospheric pressure: A hypothesis to explain the spatial synchrony
https://www.nature.com/articles/srep27225
Relationship between El Niño /South Oscillation (ENSO) and population outbreaks of some lemmings and voles in Europe
https://link.springer.com/article/10.1007/BF02900679
Pingback: Odd cycles in Length-of-Day (LOD) variations | GeoEnergy Math
Pingback: Paleo ENSO | GeoEnergy Math