The last set of cross-validation results are based on training of held-out data for intervals outside of 0.6-0.8 (i.e. training on t<0.6 and t>0.8 of the data, which extends from t=0.0 to t=1.0 normalized). This post considers training on intervals outside of 0.3-0.6 — a narrower training interval and correspondingly wider test interval.


These are largely substantiating results, with some becoming more prone to over-fitting. If the results showed indications of over-fitting, the biennial limit was set to true, as shown in the title bar of the top graph.
Climate indices
Same change in training interval, automatically applying a fitted trend. The CV results arguably appear even more impressive


The change in training interval is not totally orthogonal, as they do share fractions <0.3 and >0.8 yet there is no indication of non-stationarity in the underlying behavior.
The overall cross-validation is rigorous as it spans dimensions of (1) training intervals, (2) geospatial domains, and (3) measurement domains — as the domains of climate indices (temperature, atmospheric pressure, etc) are distinct from SLH readings, indicating a lunar torque-based unified model of Earth dynamics. The addition of local SLH readings, which was only treated in a conventional sense in Mathematical Geoenergy, provides a striking dose of pragmatism to the unified model. It’s truly pragmatic in the sense that it’s hard to argue against lunar tidal forces as a factor in SLH, especially considering how long the non-linear formulation has been overlooked.
QBO fitted to analyze “anomalous” behaviors.
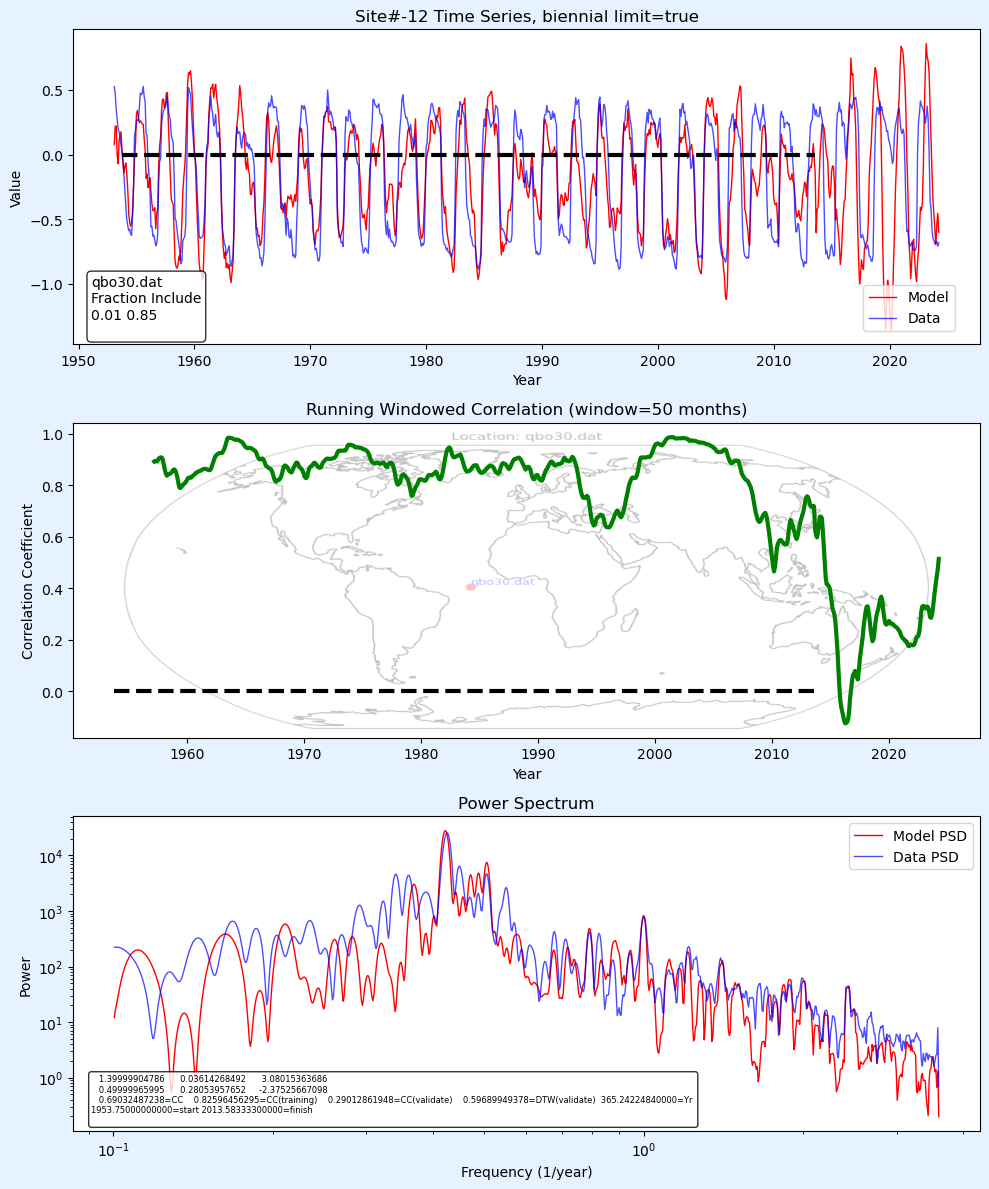
https://pukpr.github.io/results/-12site0.01-0.85.png
Trained on data before the anomalous events of 2015-2016 and 2019-2020, see:
https://agupubs.onlinelibrary.wiley.com/doi/pdf/10.1029/2024JD042419
https://journals.ametsoc.org/view/journals/atsc/78/2/jas-d-20-0172.1.xml