Recent research say QBO frequency is emergent property

Gavin Schmidt of NASA tweeted a cite to a recent paper on QBO by a group of 12 scientists

Geller, M. A., Zhou, T., Shindell, D., Ruedy, R., Aleinov, I., Nazarenko, L., Tausnev, N.L., Kelley, M., Sun, S., Cheng, Y., Field, R.D. and Faluvegi, G. (2016), Modeling the QBO – Improvements Resulting from Higher Model Vertical Resolution. J. Adv. Model. Earth Syst.. doi:10.1002/2016MS000699

They claim that the fundamental frequency of QBO relates inversely proportional to the pressure:

“The mean zonal winds from the ERA-Interim reanalysis are shown between 4.5 and 4.5 N between heights of 100 and 1 hPa for the 20 years 1991-2010. Note that ERA-Interim shows that approximately 8 1/2 QBO cycles occurred during this period, implying a QBO period averaging about 28 months. The model results in figure 1b show that no coherent QBO resembling observations exists for the gravity wave momentum flux forcing of 1.5 mPa, which is consistent with the steady jets at low wave forcing demonstrated by Yoden and Holton (1988). It also shows that the QBO-like oscillation for a gravity wave momentum flux forcing of 2.0 mPa has a period of about 8 years, while a forcing of 2.5 mPa gives a period of about 37 months, and a forcing of 3.0 mPa gives a period of about 25 months, and a forcing of 3.5 mPa gives a period of about 21 months. In fact, we find that the best fit to observed QBO periods is for a gravity wave momentum flux forcing of 2.9 mPa, as will be shown in the next section. “

I disagree with this interpretation. I know that this might sound like I am using the argument of personal astonishment, but I can’t see how a physical model could operate this way. If anything, pressure may modify the amplitude of the oscillations, i.e. the peak speed, but asserting that the pressure sets the oscillation period is likely the result of a model that no one understands. If it was indeed caused by the pressure, they should be able to come up with a simplified formula, like deriving the resonant frequency of a Rijke tube, instead of suggesting that it is an emergent property of a complicated model. Certainly, pitch can change as a result of say overblowing a woodwind instrument, but even there, the shifts are more than likely harmonics or overtones of the original fundamental frequency, and not a continuous change in frequency.

RHEED oscillations more here

And I realize that the QBO is obviously not an acoustic oscillation yet the physical model for any oscillation does need some sort of mathematically intuitive explanation (see figure to the right), which is greatly lacking in this paper.  To say it emerges from the model is an extremely weak argument.

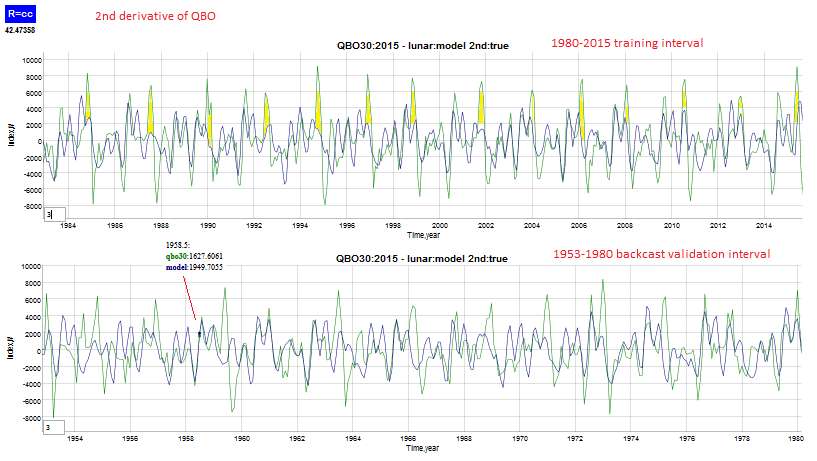
The 28 month period is ubiquitous in a number of geophysical oscillations. It shows up in (1) the seasonally aliased Draconic lunar cycle, (2) the strongest factor in the model of ENSO, (3) exactly half that period in the Chandler Wobble, (4) its defined as the mean annual flood recurrence interval by the USGS (first reported in 1960), and (5) the fundamental QBO period.

Perhaps no one wants to admit that seeing this number show up in all these measures is most likely a forced response from the nodal lunar cycle factor, as opposed to a natural resonance. The reality is that a forced response is not as “sexy” as finding a natural frequency eigenvalue.

But of course there is no way to verify either way, since a controlled experiment is not available to test a model against.  There is only one earth and it can’t be duplicated in the lab. All we have to go on is the empirical data and any model that we can dream up.


A bunch of meteorologists are freaking out that the current QBO data is not meeting up to expectations

//platform.twitter.com/widgets.js

//platform.twitter.com/widgets.js

I don’t understand the rarity of this since the higher altitude QBO aligns more with semiannual seasonal cycles, while the lower altitude QBO aligns more with the nodal lunar cycles. These will constructively add according to a beat frequency and so the alignment will occur occasionally. This summer solstice there is a full moon and that only happens once every 19 years.  I can see this with my QBO model as well, so what is the big deal?

Model of ENSO

[mathjax](update here)

Putting the finishing touches on the ENSO model, I decided to derive the Mathieu modulation of the wave equation. It’s actually a rather obvious simplification of Laplace’s Tidal Equations or the Shallow-water Wave Equation applied along the equator. That last assumption is important as the Coriolis forces are known to cancel at the equator (added: perhaps more precisely Isaac Held explains that it vanishes at the equator — it is both zero and a reversal) and so we can use a small angle approximation to reduce the set of equations to a Mathieu or Hill formulation.

To make the job even easier, the three equations that comprise the the Laplace formulation can be formulated initially in terms of the Laplace tidal operator. Per the recent reference [1], the authors separate the temporal component from the standing-wave spatial component(s) and express the operator concisely via implicit time and wavenumber (see Figure 1).

Fig 1:

Fig 1:  From [1], formulation of the Laplace Tidal Equation

Although the paper proceeds to detail the computational approach to solving the tidal equation, we will only piggy-back off the formulation and arrive at a gross simplification.

The first step is to use the small angle approximation to $$phi$$

mu = sin phi congphi


If $$ sigma gg mu $$ while $$sigma$$ not a function of $$mu$$, then the operator can be reduced to:

F(Theta) = frac{1}{sigma^2} left( frac{d^2Theta}{dmu^2} - left[frac{s}{sigma} + s^2right] Theta right)


The next crucial step is to extract the implicit temporal change from $$mu$$ via the chain rule.  Even though $$mu$$ is small, changes in $$mu$$ have to be retained to first-order or else the solution would be static along the equator.

frac{d^2Theta}{dmu^2} = frac{d^2Theta}{dt^2} frac{d^2t}{dmu^2}

added 6-17-2016: In spirit, the above is close, but not a correct expansion.
The actual chain-rule expansion is a bit more complicated and features first-derivative cross-terms.
Will get to that later, not a big deal.

The second term has the dimensions of a reciprocal latitudinal acceleration. If we assume that $$ mu = mu_0 sin(omega t) $$, then
F(Theta) = - frac{1}{sigma^2} left( frac{d^2Theta}{d t^2} frac{1}{mu_0 omega^2 sin(omega t)} + left[frac{s}{sigma} + s^2right] Theta right)


With that simplification, we reduce the formulation to a temporal second-order differential equation.

frac{1}{sigma^2} left( frac{d^2Theta}{d t^2} frac{1}{mu_0 omega^2 sin(omega t)} + left[frac{s}{sigma} + s^2right] Theta right) + gamma Theta = f(t)


where f(t) is a forcing added to the right-hand side (RHS).

Moving the $$sin(omega t)$$ from the denominator, we recover the Mathieu-like wave equation formulation:

frac{d^2Theta}{dt^2} + left[frac{s}{sigma} + s^2 + sigma^2 gamma right] Theta mu_0 omega^2 sin(omega t) = sigma^2 mu_0 omega^2 sin(omega t) f(t)


For now, the primary objective is to verify the sinusoidal behavior in terms of correlating periodicities. Previously, we determined that the f(t) term was composed of seasonally aliased lunar periods, such as the Draconic 27.2 day cycle. (Recently I also found this term buried in the LOD data.)

And the Mathieu modulation likely includes an annual contribution, and, importantly, a strict biennial cycle $$omega=pi$$, which is both observed and implied based on other climatic measures.

The seasonally aliased 27.2 day cycle generates harmonics in ENSO at the same locations as for QBO
1/T = 1/P + n, where P is the tidal period in years, and n is … -3, -2, -1, 0

so for Draconic, 1/T = 365.242/27.2 = 13.43. Stripping off the integer, the value of 0.43 is apparent (and 0.43-1=-0.57) as the strongest low-frequency factor in the power spectrum of Figure 2. Similarly for the fortnightly Draconic (13.6 day), 1/T = 365.242/13.6 = 27.85, and stripping off the integer, one gets 0.85 (and 0.85-1=-0.15). This also corresponds to the Chandler wobble. And with the multiplicative biennial modulation factor adding a +/- 0.5 to each aliased value, the other candidates are 0.85-0.5 = 0.35, 0.43+0.5 = 0.93 (and -0.57+0.5=-0.07, -0.15-0.5=-0.65). All these values are observed as among the strongest low-frequency components in the power spectrum below.

Fig. 2:  The strongest components correspond to the seasonally aliased Draconic period. The arrows separate the biennial symmetric terms.

The model fit to the ENSO spectrum is shown in Figure 3. This includes more than the Draconic terms, including potential Tropical fortnight (27.32/2 day) and Anomalistic (27.55 day) terms. Apart from the 1/f filtering envelope, the symmetry about the f=0.5/yr is evident. Note that the power spectrum calculated is essentially the LHS response (data) against the RHS forcing (model). The second derivatives and modulation are included in the LHS, so it is not completely “raw” data.

Fig. 3:  ENSO power spectrum comparison to model

And in temporal space, the multiple regression fit is shown in Figure 4. Interesting that the correlation coefficient is higher outside the training interval than within the training interval!

Fig. 4: Fit using the training interval from 1881 to 1950.

This is a very elegant theory in terms of deriving from first-principles; the fact that it is a simplification direct from Pierre Laplace’s original tidal formulation means that we have bypassed sophisticated GCM approaches to potentially solving ENSO .  The only caveats to mention are the phase inversion from 1981 to 1996, and the imprecision of the  Draconic term, where 27.199 days fits better than 27.212 days.  The former aligns with a 7 year interval as there are precisely 94 cycles of 27.199 day periods in 7 years.  As ENSO is known to be seasonally aligned, this makes qualitative sense. However, the phase error from that cycle to the actual Draconic cycle will build up over time, and it will eventually go completely out of phase after 70+ years.  This actually may be related to the 1981 phase inversion, as that would be a means of re-aligning the phase after a number of years (Another phase inversion may occur prior to 1880, see comment).

The white paper is located on arXiv.

I have to get to work so will leave this post subject to fixing any Latex markup typos later. (Note: fixed some sign-carryover errors due to the 2nd-deriv, same day as posting)

References

[1] Wang, Houjun, John P. Boyd, and Rashid A. Akmaev. “On computation of Hough functions.” Geoscientific Model Development 9.4 (2016): 1477. PDF

QBO Aliasing Graph

Before getting to the needless complexity discussion hinted at in the last post, here is a simple graphical analysis of finding aliased frequencies. Based on this analysis one can determine aliased signals by looking at the frequency power spectrum. The rules for aliasing in frequency space involve peeling back from the assumed frequency until the aliased harmonics appear in the spectrum.

1/T = 1/P + n, where P is the tidal period in years, and n is … -3, -2, -1, 0

So applying the Draconic period aliasing to QBO, the harmonics are clearly seen in the following Figure 1.  The strongest factor is the approximately 2.33 year period shown on the left, but since this is a second derivative of the QBO time series, higher frequency aliased harmonics are also observed to the right.  Note that the factors are approximately 0.43, 1.43, and 2.43, which are separated by Δn=1. And note that 1/0.43 ~ 2.33 years, which is the approximate observed QBO frequency..

Fig. 1:  Spectrum of the second derivative of QBO, showing seasonally aliased factors

Other potential periods are shown in the figure, including the unaliased annual and semi-annual signals separated by the violet colored arrow. The green arrow separates the harmonics of the 13.633 day lunar tide periodicity. Clustered around the strong Draconic period are also satellite frequencies. At least one of these satellites along with the strong aliased Draconic also appear in the LOD spectrum. That provides the physical basis for QBO (and also ENSO) forcing.

Putting these factors together via multiple regression results in marvelous fits of the various QBO time series, as seen in Figure 2 below.

Fig. 2:  Multiple regression fit of the 30 hPa QBO time series.

And to highlight the second derivative composition and how the higher frequency aliased harmonics contribute to the fine detail, see Figure 3.

Fig. 3 : Second derivative of QBO highlights the higher frequency aliased harmonic detail.

Only in a few places do the aliased harmonics not appear well aligned. Those years, such as the interval 1983-1984 may be telling us that other climate events may be playing a role in temporarily impacting the QBO dynamics.

Seasonal Aliasing of Long-Period Tides Found in Length-Of-Day Data

From a careful analysis of Length-of-Day (LOD) measurements, we can glean lots of information about phenomenon such as tides, earthquakes, core/mantle motion, and ENSO [1].  In Figure 1 below, one can see how this is manifested at different time scales.

Fig. 1: Differing temporal scales of LOD analysis.  Short period tides have scale of diurnal and semidiurnal.

I revisited the LOD data to see if I could detect the angular momentum changes that appear to force the QBO and ENSO oscillations, similar to what Wang et al do in [2].  In each of these natural behaviors, there is a clear indication that the 2.369 year seasonally-aliased long period draconic tide is a primary forcing mechanism.

There are two sets of data to look at. The original set from Gross at JPL called LUNAR97 [3] is not online in a machine-readable format, but it is included in the paper. So it was a simple matter to OCR a GIF of the paper’s table. Another more recent set is available from IERS here.

Fig. 2: Compariscon between the two LOD data sets.  The Gross set has less filtering

The issue with the more recent set is that the site claims that they do a “5-point quadratic convolute”, at least up to 1955.  I don’t want any filtering, so chose the Gross LUNAR97 set. You can see the difference between the two data sets in Figure 2 above.

To draw out the fine features even more, I performed a straightforward second-derivative on the LUNAR97 time-series (same approach as used on the QBO see result). This was then fed into a symbolic regression machine learning tool to determine the principle components. The results are shown in Figure 3 below.

Fig. 3:  Result of machine learning on 2nd-derivative of LOD data.

After about an hour of machine learning, the solution included a strong frequency at 22.481 rads/year.  In Figure 3, that solution was one of the simplest along the Pareto front, shown by the red dot. This frequency is aliased to the slower frequency of 2.3694 rads/year, which is correspondingly seasonally aliased to an approximate lunar month of 27.2121 days. Incredibly, but perhaps not surprisingly, this compares to the known draconic or nodal lunar month length of 27.21222 days.   The other somewhat weaker term is very close to aliasing the anomalistic lunar month of 27.55 days, in the fortnight mode of 13.777 days.

That was the first run I attempted and subsequent runs are picking out some other potential long-period lunar periods (and also the 6.45 year Chandler wobble), but this is really enough to demonstrate a salient result — that the same draconic period that the QBO model uses and that the ENSO model uses as the primary angular momentum forcing term also appears in the most direct and practical measurement of angular momentum known in Earth geophysics.   And I do not think this is a instance of artificial sampling aliasing, since each of the LOD measurements was averaged over at least a month.  It is likely a real seasonal aliasing behavior and serves to further substantiate the theorized mechanisms forcing the QBO and ENSO behavior.   Read the short paper that I placed into arXiv to see how the other parts fall into place.

And a continuing lesson to be learned is to not filter data unless you can be sure that what you are filtering out is nuisance noise. In this case, it appears the filtering performed by IERS was too aggressive and removed a very important signal in the time series! Contrary to what the statistician Tamino has been preaching, these time-series do not have a lot of statistical content. I donated money to his lessons on time-series analysis, but largely disagree on the applicability of his approaches to earth data such as we see in QBO, ENSO, Chandler wobble, and now LOD. If you followed his instructions, you might not find any of the periodic cycles buried in the data, and you might dismiss it all as red noise. Yet, there is likely nothing statistical or complex about these behaviors, as they are largely driven by known deterministic forces. Stay tuned, as the next post will be titled “Needless Complexity”.

References

[1] B. Fong Chao, “Excitation of Earth’s polar motion by atmospheric angular momentum variations, 1980–1990,” Geophysical research letters, vol. 20, no. 3, pp. 253–256, 1993.

[2] Shen, Wen-Jun Wang Wen-Bin, and Han-Wei Zhang. “Verifications for Multiple Solutions of Triaxial Earth Rotation.”  PDF

Note: the authors in [2] also find a 14-year signal in the LUNAR97 data (see figure below). This is likely a result of a wavelet filter that isolated periods between 8 and 16 years as they described the windowing procedure.  This 14 year period is critical in the ENSO model.

From Wang et al, Figure 6 “Spectrum of wavelet for data series LUNAR97 with evident peak at period 14 yr “.   The reciprocal of 0.0715 cycles/year is 14 years.

[3] Gross, Richard S. “A combined length-of-day series spanning 1832–1997: LUNAR97.” Physics of the Earth and Planetary Interiors 123.1 (2001): 65-76.  PDF


Biennial Stratosphere Mode

In addition to the biennial mode found in ENSO and in GPS readings, a stratospheric biennial mode also exists. This is different than the quasi-biennial oscillation (QBO) modeled previously, as it shows a more strict two year cycle.

From Dunkerton [1]:

Second, concerning their time dependence, subbiennial variations should not be viewed in isolation from other modes. The seasonal dependence of QBO anomalies cannot be described by a single harmonic, whether quasi-biennial or subbiennial; rather, their superposition provides for the seasonality.

Only three parameters were varied to obtain the least squares fit: the QBO period, QBO phase, and subbiennial phase. This calculation was performed on the three tracers independently, but the same QBO period was obtained in each case, namely, 26 months. The corresponding subbiennial period is 22.3 months

What Dunkerton is talking about essentially is akin to a 2.166 year quasi-biennial signal mixed with a 1.858 year sub-biennial signal. These combine in frequency space as Dunkerton states by their superposition, and also couple together via a ~26-year modulation on the biennial signal — as per the trig identity:

cos(2pi t/2.166) + cos(2pi t/1.858) = 2 cos(pi t) cos(2pi t/26)


This is substantiated by Remsberg in his methane study [2] where in addition he sees a smaller amplitude factor which is closer to the exact biennial signal.

Three interannual terms are almost always present and are 19 included in the model: an 838-dy (27.5-mo) or QBO1 term; a small amplitude, 718-dy (23.5-mo) biennial or QBO2 term; and a 690-dy (22.6-mo) sub-biennial (SB) term, whose period arises from the difference interaction between QBO and annual terms. The relative amplitudes of these three interannual terms vary with latitude and altitude.

More recently (in 2014) Remsberg reports [5]:

Instead, Fourier analysis of the time series of the residuals after removing the seasonal terms almost always indicates that there are two significant, interannual terms having periods of order of 28 (QBO-like) and 21 months (subbiennial term denoted as IA).

This is akin to a 2.333 year quasi-biennial signal mixed with a 1.75 year sub-biennial signal, leading to a 14-year signal modulating the biennial signal:

cos(2pi t/2.333) + cos(2pi t/1.75) = 2 cos(pi t) cos(2pi t/14)


Which is strikingly similar to the behavior observed in the ENSO model’s 14-year modulation of the biennial cycle. The idea was that this 14 year modulation is close to the additional triaxial wobble suggested by Wang.  Slightly weaker is an 18.6 year modulation which is close to the lunar nodal period.

Fig. 1:  Biennial modulation in the ENSO power spectrum

The similarity between the stratospheric measures and the ENSO observations is based on the common behavior of a symmetrical balance about the biennial cycle. This is starkly observed in the power spectrum of ENSO shown above.

In a closely related finding, the single-minded AGW-denier Murry Salby also discusses this modulation in [6], but ascribes the modulation to the sunspot cycle, as he finds a value closer to an 11-year modulation. That assumption has to be taken with some circumspection, as it is well known that Salby favors a solar-based rationale to global temperature variation, which has gotten himself into some bizarre predicaments.

References

1. Dunkerton, Timothy J. “Quasi-biennial and subbiennial variations of stratospheric trace constituents derived from HALOE observations.” Journal of the atmospheric sciences 58.1 (2001): 7-25.
2. Remsberg, Ellis E. “Methane as a diagnostic tracer of changes in the Brewer–Dobson circulation of the stratosphere.” Atmospheric Chemistry and Physics 15.7 (2015): 3739-3754.
3. Remsberg, E. E., and L. E. Deaver. “Interannual, solar cycle, and trend terms in middle atmospheric temperature time series from HALOE.” Journal of Geophysical Research: Atmospheres 110.D6 (2005).
4. Remsberg, Ellis E. “On the observed changes in upper stratospheric and mesospheric temperatures from UARS HALOE.” NASA Langley Report (2006).
5. Remsberg, E. E. “Decadal-scale responses in middle and upper stratospheric ozone from SAGE II version 7 data.” Atmospheric Chemistry and Physics 14.2 (2014): 1039-1053.
6. Salby, Murry, Patrick Callaghan, and Dennis Shea. “Interdependence of the tropical and extratropical QBO: Relationship to the solar cycle versus a biennial oscillation in the stratosphere.” Journal of Geophysical Research: Atmospheres 102.D25 (1997): 29789-29798.

frac{1}{2.333} + frac{1}{1.75} = 1


Validating ENSO cyclostationary deterministic behavior

I tend to write a more thorough analysis of research results, but this one is too interesting not to archive in real-time.

First, recall that the behavior of ENSO is a cyclostationary yet metastable standing-wave process, that is forced primarily by angular momentum changes. That describes essentially the physics of liquid sloshing. Setting input forcings to the periods corresponding to the known angular momentum changes from the Chandler wobble and the long-period lunisolar cycles, it appears trivial to capture the seeming quasi-periodic nature of ENSO effectively.

The key to this is identifying the strictly biennial yet metastable modulation that underlies the forcing. The biennial factor arises from the period doubling of the seasonal cycle, and since the biennial alignment (odd versus even years)  is arbitrary, the process is by nature metastable (not ergodic in the strictest sense).  By identifying where a biennial phase reversal occurs, the truly cyclostationary arguments can be isolated.

The results below demonstrate multiple regression training on 30 year intervals, applying only known factors of the Chandler and lunisolar forcing (no filtering applied to the ENSO data, an average of NINO3.4 and SOI indices). The 30-year interval slides across the 1880-2013 time series in 10-year steps, while the out-of-band  fit maintains a significant amount of coherence with the data:

Continue reading

Common Origins of Climate Behaviors

I have been on a path to understand ENSO via its relationship to QBO and the Chandler wobble (along with possible TSI contributions, which is fading) for awhile now. Factors such as QBO and CW have all been considered as possible forcing mechanisms, or at least as correlations, to ENSO in the research literature.

Over time, I got sidetracked into trying to figure out the causes of QBO and the Chandler wobble hoping that it might shed light into how they could be driving ENSO.

But now that we see how the QBO and the Chandler wobble both derive from the seasonally aliased lunar Draconic cycle, it may not take as long to piece the individual bits of evidence together.

I am optimistic based on how simple these precursor models are. As far as both QBO and the Chandler wobble are concerned, one can’t ask for a simpler explanation than applying the moon’s Draconic orbital cycle as a common forcing mechanism.

As a possible avenue to pursue, the post on Biennial Connection from QBO to ENSO seems to be the most promising direction, as it allows for a plausible phase reversal mechanism in the ENSO standing wave. I’ll keep on kicking the rocks to see if anything else pops out.


Daily Double

[mathjax]A short piece that ties together the analysis of ENSO and QBO over the last year.

The premise has been that periodic changes in angular momentum applied to the earth’s rotation is enough of a forcing to steer the behavior of the El Nino Southern Oscillation (ENSO) in the equatorial Pacific ocean and of the Quasi-Biennial Oscillation (QBO) in upper atmospheric winds. Whoever would have you believe that these behaviors could be spontaneously generated is clearly not thinking straight. For every action there is a reaction, and both QBO and ENSO are likely reactions to the same forcing action.

Both this forum (and the Azimuth Project forum) has provided plenty of analysis to show exactly how that comes about, but in retrospect, it’s the machine learning (ML) experiments via Eureqa that has provided the most eye-opening evidence. Robots find what they find and since they are free from the vagaries of human nature, they can’t lie about what they discover.

The first two for QBO have a primary sinusoidal factor that are nearly identical, 2.66341033 and 2.663161 rads/year, and the ENSO has a value 2.64123448 rads/year. If the first two values are averaged and then that is averaged with the ENSO value, the result is 2.65226007 rads/year (the significant figures are as reported by Eureqa). That value is equivalent to a seasonally aliased 2.65226007 +13$$cdot$$2$$pi$$ rads/year, which is a period of 27.21195913 days — while the Draconic lunar month is 27.21222082 days. That’s an error of 0.00096%.

So the primary ENSO forcing period as determined by ML was a tiny bit shorter than the Draconic and the primary QBO forcing period was a wee bit longer than the Draconic period. Given that is partly due to noise in the fit, it’s reassuring to see that the average would get even closer to a plausible forcing value.

The entire premise of the lunar forcing driving both QBO and ENSO hinges on the precision of the modeled values; as the cycles of a lunisolar model can quickly get out of sync with the data unless enough precision is available to span 60 to 100 years.

Recall again these words by the professional contrarian scientist Richard Lindzen:

” 5. Lunar semidiurnal tide : One rationale for studying tides is that they are motion systems for which we know the periods perfectly, and the forcing almost as well (this is certainly the case for gravitational tides). Thus, it is relatively easy to isolate tidal phenomena in the data, to calculate tidal responses in the atmosphere, and to compare the two. Briefly, conditions for comparing theory and observation are relatively ideal. Moreover, if theory is incapable of explaining observations for such a simple system, we may plausibly be concerned with our ability to explain more complicated systems. Lunar tides are especially well suited to such studies since it is unlikely that lunar periods could be produced by anything other than the lunar tidal potential. The only drawback in observing lunar tidal phenomena in the atmosphere is their weak amplitude, but with sufficiently long records this problem can be overcome [viz. discussion in Chapman and Lindaen (1970)] at least in analyses of the surface pressure oscillation. ” — from Lindzen, Richard S., and Siu-Shung Hong. “Effects of mean winds and horizontal temperature gradients on solar and lunar semidiurnal tides in the atmosphere.” Journal of the Atmospheric Sciences 31.5 (1974): 1421-1446.

tides courtesy of NOAA

That bolded part is the monetary payoff. If Lindzen, who is known as the father of QBO theory, asserts that if measured periods aligning with lunar periods is a sufficient comparison, then he would be forced into agreeing with this current analysis. Nothing else will come close to the precision required.

And the payoff turns into the daily double as it also works for explaining ENSO. The combination of parsimony and plausibility is hard to argue with.

Project Loon and QBO

Missed this recent development related to QBO. Google is planning on deploying balloons to the stratosphere which carry transceivers capable of improving global Internet capability.

This is the stratosphere, so remember that the Quasi-Biennial Oscillation (QBO) of winds will likely play an important role in how the balloons get carried aloft around the earth. Google scientists and engineers might want to consider in more detail how the winds alternate in east-west directions, as their image below shows.

Based on a detailed modeling of previous wind data collected by similar high-altitude deployed balloons, the origin of the QBO is becoming less mysterious. From the data collected from these so-called radiosonde measurements, the origin of this alternation is not according to that proposed by the AGW-denier scientist Richard Lindzen, but via the periodic gravitational pull of the moon, aliased by a seasonal modulation. This is described in a short two-page paper worked out both on this site, and at the collaborative Azimuth Project forum.

The model’s ability in capturing the dynamics of QBO is amazing:

Fig 1: Modeling the second derivative of QBO to lunar tidal periods allows a highly detailed predictive capability.  Training the data on a known set of lunar tidal periods (red interval), forecasts the “out-of-bad” data remarkably well !

This modeling is actually quite trivial and as straightforward as modeling the cyclic behavior of ocean tides, but one has to understand how aliasing works.  That is what  Lindzen apparently missed during his 50 years worth of hapless research efforts.

Besides the importance for this Google project, the QBO has lots of relevance for climate, including predicting storm activity and occurrence of El Ninos.


More on Project Loon

Project Loon balloon
Loon for All – Project Loon

How Loon Works – Project Loon

Project Loon – Wikipedia