We use seasonal aliasing of the lunar gravitational pull to generate the incredible fits to the QBO.
How does one get the harmonics of the aliasing?
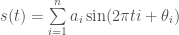
The starting premise is that a known lunar tidal forcing signal is periodic

The seasonal signal is likely a strong periodic delta function, which peaks at a specific time of the year. This can be approximated as a Fourier series of period 
For now, the exact form of this doesn’t matter, as what we are trying to show is how the aliasing comes about.
The forcing is then a combination of the lunar cycles 


Multiplying this out, and pulling the lunar factor into the sum

then with the trig identity

Expanding the lower frequency difference terms and ignoring the higher frequency additive terms
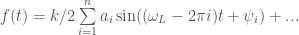
Now you can see how the high frequency 

This is a link to the interactive QBO app on the dynamic context server: http://entroplet.com/context_qbo/navigate

Is this similar in effect to a Moiré pattern, or to a beat frequency for two nearly-similar frequencies?
LikeLike
Also, in the final equation, not following you at all. What is psi?
LikeLike
Keith, $$\psi$$ is the phase angle, which is a constant and required to set the alignment of the sinusoids over time. So that $$\phi_i$$ and $$\theta$$ will combine in some way (not derived because not important) to get $$\psi$$.
An alternative way to look at this of course is to chart the values on a spreadsheet and sample the data on seasonal boundaries.
LikeLike
Thanks, I’ll give that a try.
LikeLike
Charting is the easiest way to check the math.
Aliasing is not the most intuitive of processes and can really mess with your thinking. So once you can be certain what is going on, your mind can become more comfortable with it.
LikeLike
Hi Paul,
I tried the QBO on the entroplet server, very nice!
Using only 3 parameters and matching 1953 to 1980, I get a CC of 38.2 vs 44 with 18 parameters. It is not clear that the additional parameters give you a lot, probably better to keep the number of parameters as low as possible to avoid overfitting. I might have this wrong as I am assuming RMS=0 means the parameter was not used (coefficient set to zero in regression). Couldn’t post chart, but the 2.72, 2.37, and 0.5 parameters had RMS>0.
LikeLike
Pingback: QBO Aliasing Graph | context/Earth
Pingback: Simplifying Laplace’s Tidal Equations for QBO | context/Earth
Pingback: Tidal Model of ENSO | context/Earth
Pingback: Scaling El Nino | context/Earth
Pingback: Biennial Connection to Seasonal Aliasing | context/Earth
Pingback: QBO Model Validation | context/Earth