Amazing finding from Alex’s group at NASA JPL
- Konopliv, Alex S., et al. “Detection of the Chandler Wobble of Mars From Orbiting Spacecraft.” Geophysical Research Letters 47.21 (2020): e2020GL090568.
What’s also predictable is that the JPL team probably have a better handle of what causes the wobble on Mars than we have on what causes the Chandler wobble (CW) here on Earth. Such is the case when comparing a fresh model against a stale model based on an early consensus that becomes hard to shake with the passage of time.
Of course, we have our own parsimoniously plausible model of the Earth’s Chandler wobble (described in Chapter 13), that only gets further substantiated over time.
The latest refinement to the geoenergy model is the isolation of Chandler wobble spectral peaks related to the asymmetry of the northern node lunar torque relative to the southern node lunar torque.

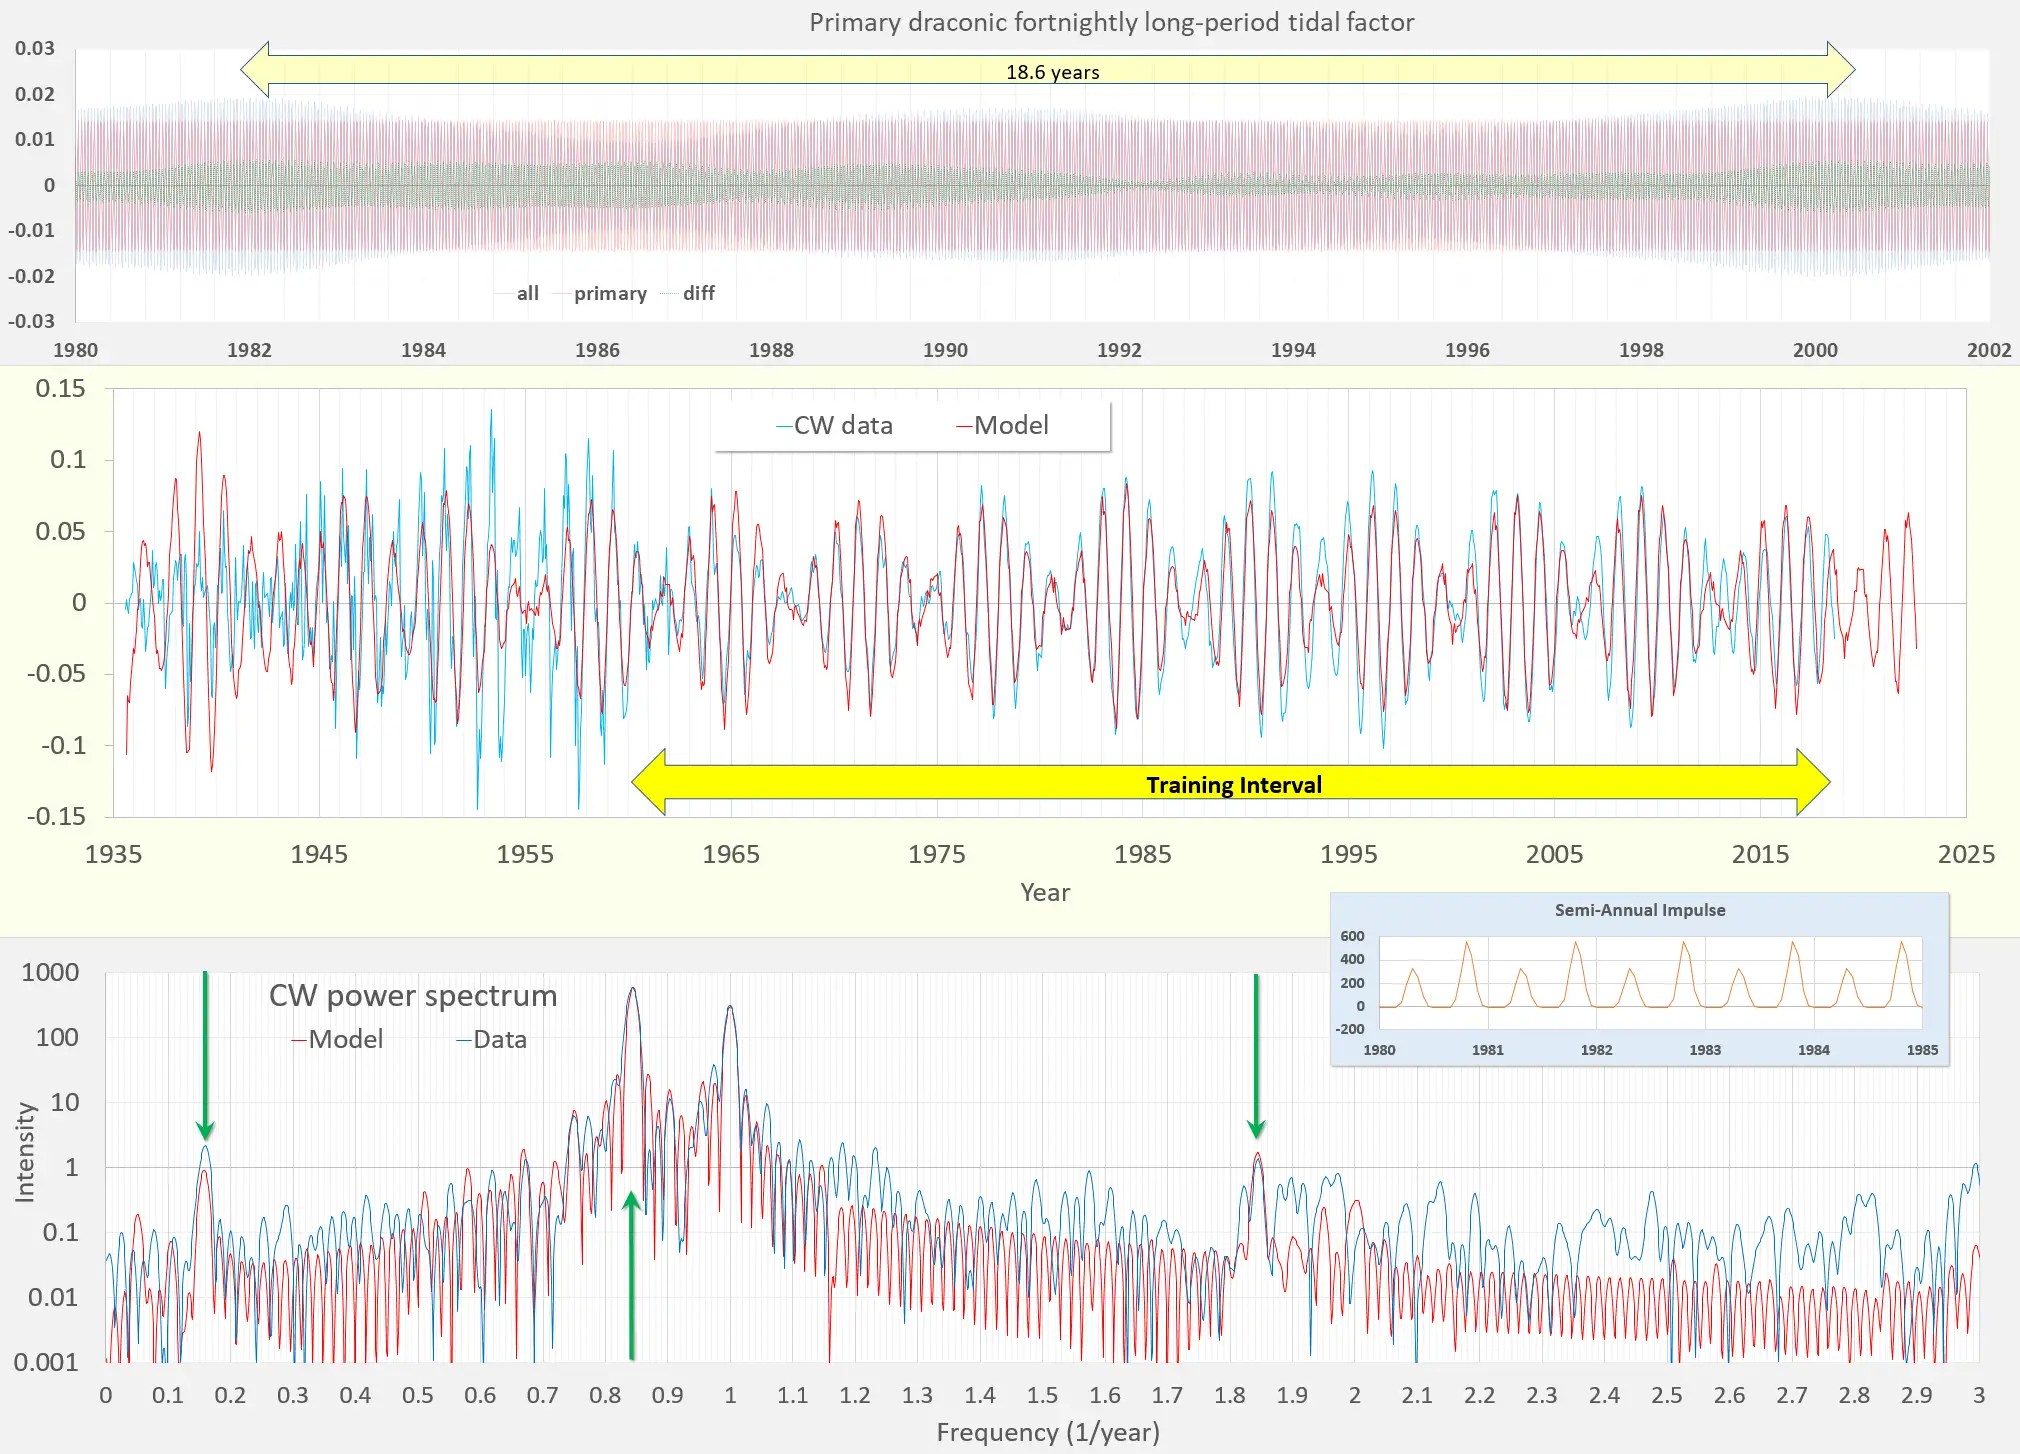
In the figure below, the main Chandler wobble frequency is indicated by the upward GREEN arrow in the CW power spectrum. The frequency of 0.843/year is predicted by the aliasing of an annual impulse with the fortnightly draconic/nodal lunar tidal cycle, providing a twice-annual sharp torquing (but variable due to aliasing) and thus sustaining the polar axis cyclic wobble. Consider also that if the southern node torque is equal to the northern node torque, then spectral peaks at 0.157/year and 1.843/year will not emerge in the calculated Fourier terms. Thus the symmetric-forcing model spectrum in RED does not reveal the additional satellite terms, even though these satellite terms do occur in the data, indicated by the pair of downward GREEN arrows pointing to peaks in the the BLUE curve.

Although these are at low power levels they are the only ones emerging above the unity intensity level away from the main Chandler spectral peak, so are important from the perspective of a foundational understanding of the physical mechanism behind the wobble. And sure enough, by introducing an asymmetry in the relative northern node to southern node impulse, the two additional satellite peaks emerge clearly from the background, and precisely align with the empirical observations. So look again in the chart below at the asymmetric semi-annual impulse in the inset and then note how much that it raises the intensity of the modeled satellite peaks to match the level of the observed peaks (pointed at by the downward GREEN arrows).
Summary: For the two impulse variations (symmetric vs. asymmetric), the summed intensity are equal so it has no effect on the primary spectral peak, but does cause the emergence of the additional satellite terms, and thus further substantiates the lunar torquing model as a parsimonious mechanism to explain the empirical observations. And since the northern hemisphere does have differing characteristics than the southern hemisphere, such an asymmetry-related feature should plausibly emerge from the empirical observations. A remaining puzzle is to isolate the spring and fall impulses to the corresponding northern vs southern nodal swings — since there is always a lag phase associated with a forced response, it is not yet perfectly clear that the fall impulse is associated with the northern swing (larger impulse due to a larger land mass) and the spring impulse with the southern swing.
See my latest submission to the ESD Ideas issue for an ongoing critical discussion on the CW : ESDD – ESD Ideas: Long-period tidal forcing in geophysics – application to ENSO, QBO, and Chandler wobble (copernicus.org) The modeling software is available from GitHub.
And a reminder:

In my submission to ESD Ideas referred to above, I have received a review from L. Zotov, who recently wrote a paper on the Chandler wobble, here
https://syrte.obspm.fr/astro/journees2019/FILES/zotov.pdf
The bottom-line is that most papers on the topic of Chandler wobble are researching the 2nd-order effects in long-term wobble variability without addressing the 1st-order mechanisms behind the fundamental behavior. Consider that in this recent Zotov paper, the claim is that the variability may be due to tidal effects, as opposed to the tidal effects causing the fundamental cycling as I would argue.
There’s another review from an anonymous person with the claim that Sidorenkov had the lunar connection figured out. I responded that their math did not precisely match the periods observed, and now not even close to being able to match these weaker satellite periods.
https://editor.copernicus.org/index.php/esd-2020-74-AC2.pdf?_mdl=msover_md&_jrl=430&_lcm=oc108lcm109w&_acm=get_comm_file&_ms=89994&c=195309&salt=1422692089444751966
AGU EOS
https://eos.org/research-spotlights/first-detection-of-a-built-in-wobble-on-another-planet
“Like Earth’s Chandler wobble, the motion on Mars should naturally die down. Researchers don’t yet know what is keeping the wobble going, but previous studies indicate it’s likely due to atmospheric pressure changes.”
Common-mode mechanism — see how QBO and Chandler wobble relate
https://www.researchgate.net/publication/257634063_Modelling_and_analysis_of_a_single_gimbal_gyroscopic_energy_harvester
https://pbs.twimg.com/media/ErUZCT0XAAA_K4K.png
The inverse gyroscopic wave power generator
https://youtu.be/czs6MXQGop4
Consider the wobble of a wind turbine
https://youtu.be/vhW704WrHPM
Harnessing a resonant wobble
https://youtu.be/2_5K4kmnsL4
https://twitter.com/WHUT/status/1348025438778613761
https://platform.twitter.com/widgets.js
https://onlinelibrary.wiley.com/doi/epdf/10.1002/andp.202000262
Pingback: Does GPT understand geophysics? | GeoEnergy Math
Pingback: Controlled Experiments | GeoEnergy Math
Pingback: Lunar Torque Controls All | GeoEnergy Math