This is a short comment pointing to an addition to a previous post https://geoenergymath.com/2019/02/16/autocorrelation-of-enso-power-spectrum/.
The context is looking for autocorrelations in the frequency domain of a time-series. Although not as common as performing autocorrelations in the time domain, it is equally as powerful.
The earlier idea was to look for harmonics in the periodicity of the ENSO signal, and the chart described in the post showed clear annual and higher harmonics in the time series. This was via a straightforward sliding autocorrelation in the power spectra.
As an additional technique, we can look for symmetric sidebands of the annual fundamental and harmonics frequencies by folding the spectra over about the annual frequency and performing a direct correlation calculation.
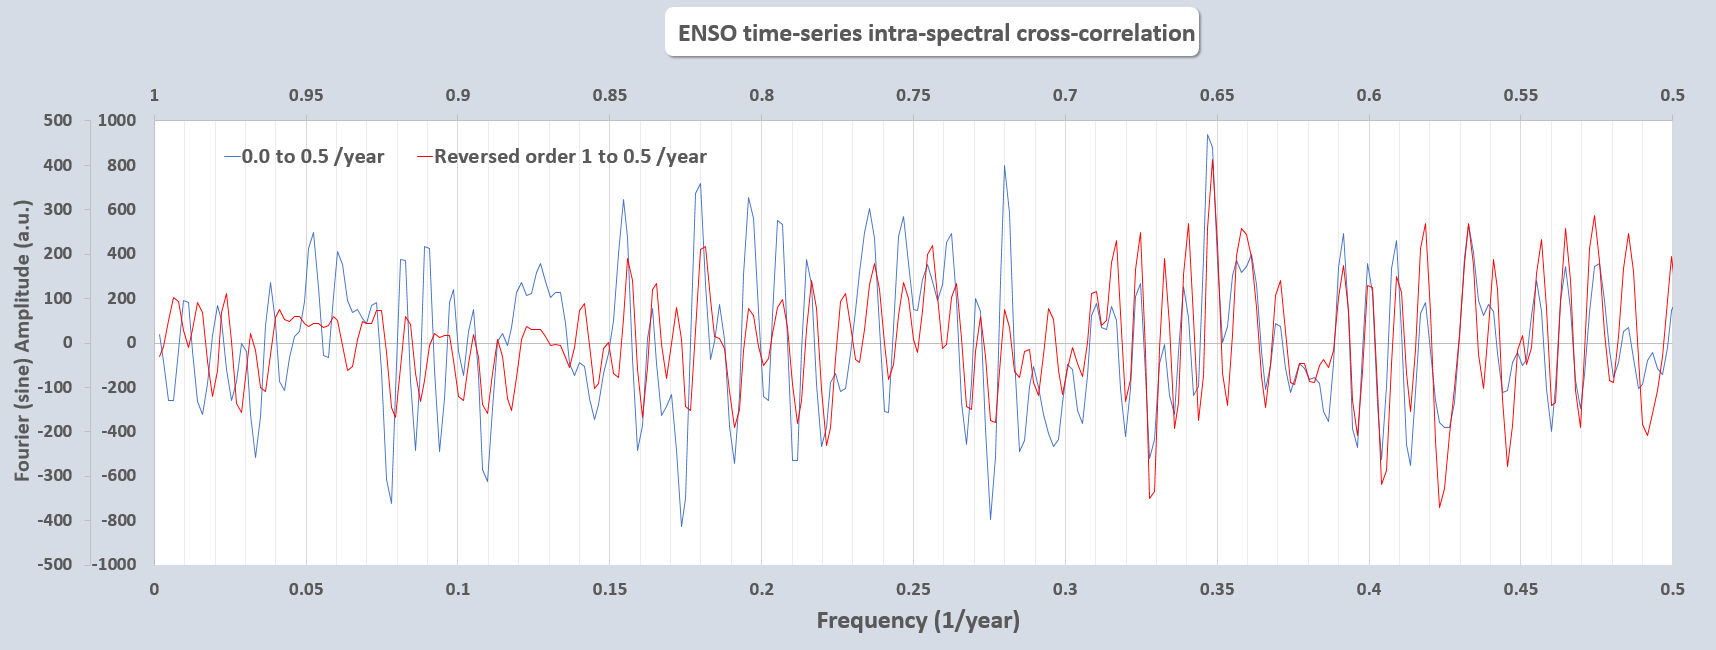
upper x-axis is the symmetric upper sideband interval (red) shown in reverse
This correlation is painfully obvious and is well beyond statistically significant in demonstrating that an annual impulse signal is modulating another much more complex forcing signal (likely of tidal origin). This is actually a well-known process known as a double-sideband suppressed carrier modulation, used most commonly in facilitating broadcast transmissions. As shown in the equations below, the modulation acts to completely suppress the carrier (i.e. annual) frequency.


Read the previous post for more detail on the approach.
Ordinarily, the demodulation is straightforward via a standard mixing approach, as the carrier signal is a much higher frequency than the informational signal, but since annual and long-period tides are of roughly similar periods, the demodulation will only complicate the spectrum. This is not a big deal as we need to fit the peaks via the LTE formulation in any case.
This is a new and novel finding and not to be found anywhere in the ENSO research literature. Why it hasn’t been uncovered yet is a bit of a mystery, but the fact that the annual signal is completely suppressed may be a hint. It may be that we need to understand why the dog didn’t bark.
Gregory (Scotland Yard detective): “Is there any other point to which you would wish to draw my attention?”
— “The Adventure of Silver Blaze” by Sir Arthur Conan Doyle
Holmes: “To the curious incident of the dog in the night-time.”
Gregory: “The dog did nothing in the night-time.”
Holmes: “That was the curious incident.”
If that is not the case, and this has been published elsewhere, will update this post.

Pacific North American (PNA) pattern explaining how the folding works
LikeLike
This is another view of the mirror cross-correlation in the ENSO amplitude spectrum
LikeLike
This is really interesting how concepts from other field can be applied to this. Can I send you a private message about something I have been thinking about for a long time, but not willing to share it here?
Where can I contact you? adventuretimesfinnandjake@gmail.com
LikeLike
Pingback: The AMO | GeoEnergy Math
Pingback: The PDO | GeoEnergy Math
Pingback: Filtering of Climate Data | GeoEnergy Math
Check the comments on this post:
https://geoenergymath.com/2020/04/06/triad-waves/
Triad waves obey the DSSC modulation requirements since the two sideband frequencies add up to the main carrier frequency.
LikeLike
Pingback: Double-Sideband Suppressed-Carrier Modulation vs Triad | GeoEnergy Math