In Chapter 12 of the book, we derived an ENSO standing wave model based on an analytical Laplace’s Tidal Equation formulation. The results of this were so promising that they were also applied successfully to two other similar oceanic dipoles, the Atlantic Multidecadal Oscillation (AMO) and the Pacific Decadal Oscillation (PDO), which were reported at last year’s American Geophysical Union (AGU) conference. For that presentation, an initial attempt was made to model the North Atlantic Oscillation (NAO), which is a more rapid cycle, consisting of up to two periods per year, in contrast to the El Nino peaks of the ENSO time-series which occur every 2 to 7 years. Those results were somewhat inconclusive, so are revisited in the following post:
The models for ENSO, PDO, and AMO share a common lunisolar forcing pattern, which is essentially an annual impulse which modulates the fortnightly and monthly tidal cycles.. This is then integrally lagged to create the ragged square-wave time-series shown in Fig 1 below
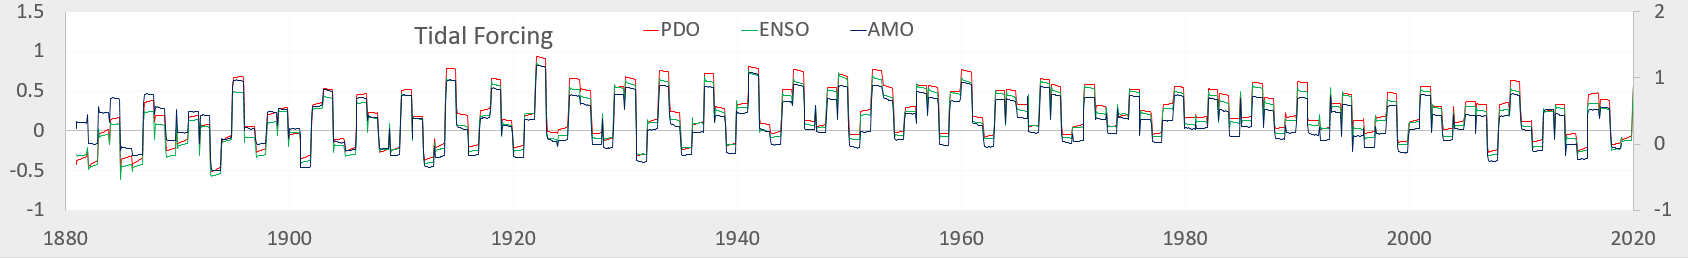
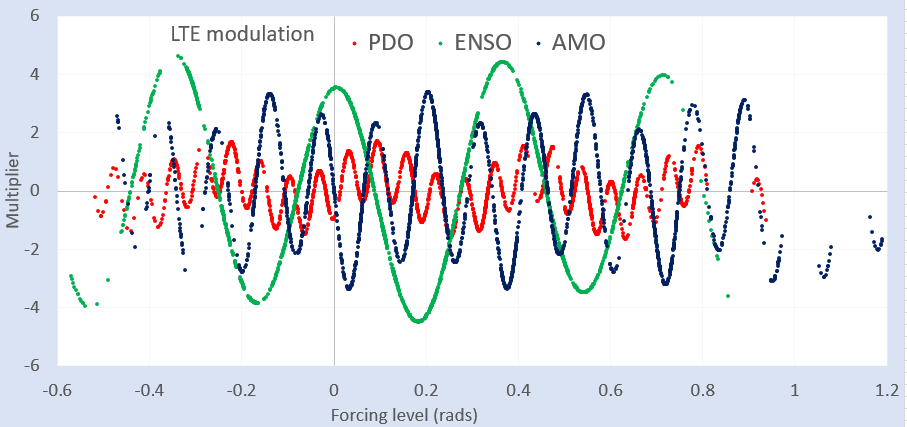
To create the distinct responses for each index, a specific level of Laplace’s Tidal Equation (LTE) modulation (as derived in Chap 11) is applied to the (close to) common tidal forcing. These are shown in Fig 2 below and are associated with a distinct spatio-temporal standing wave pattern.
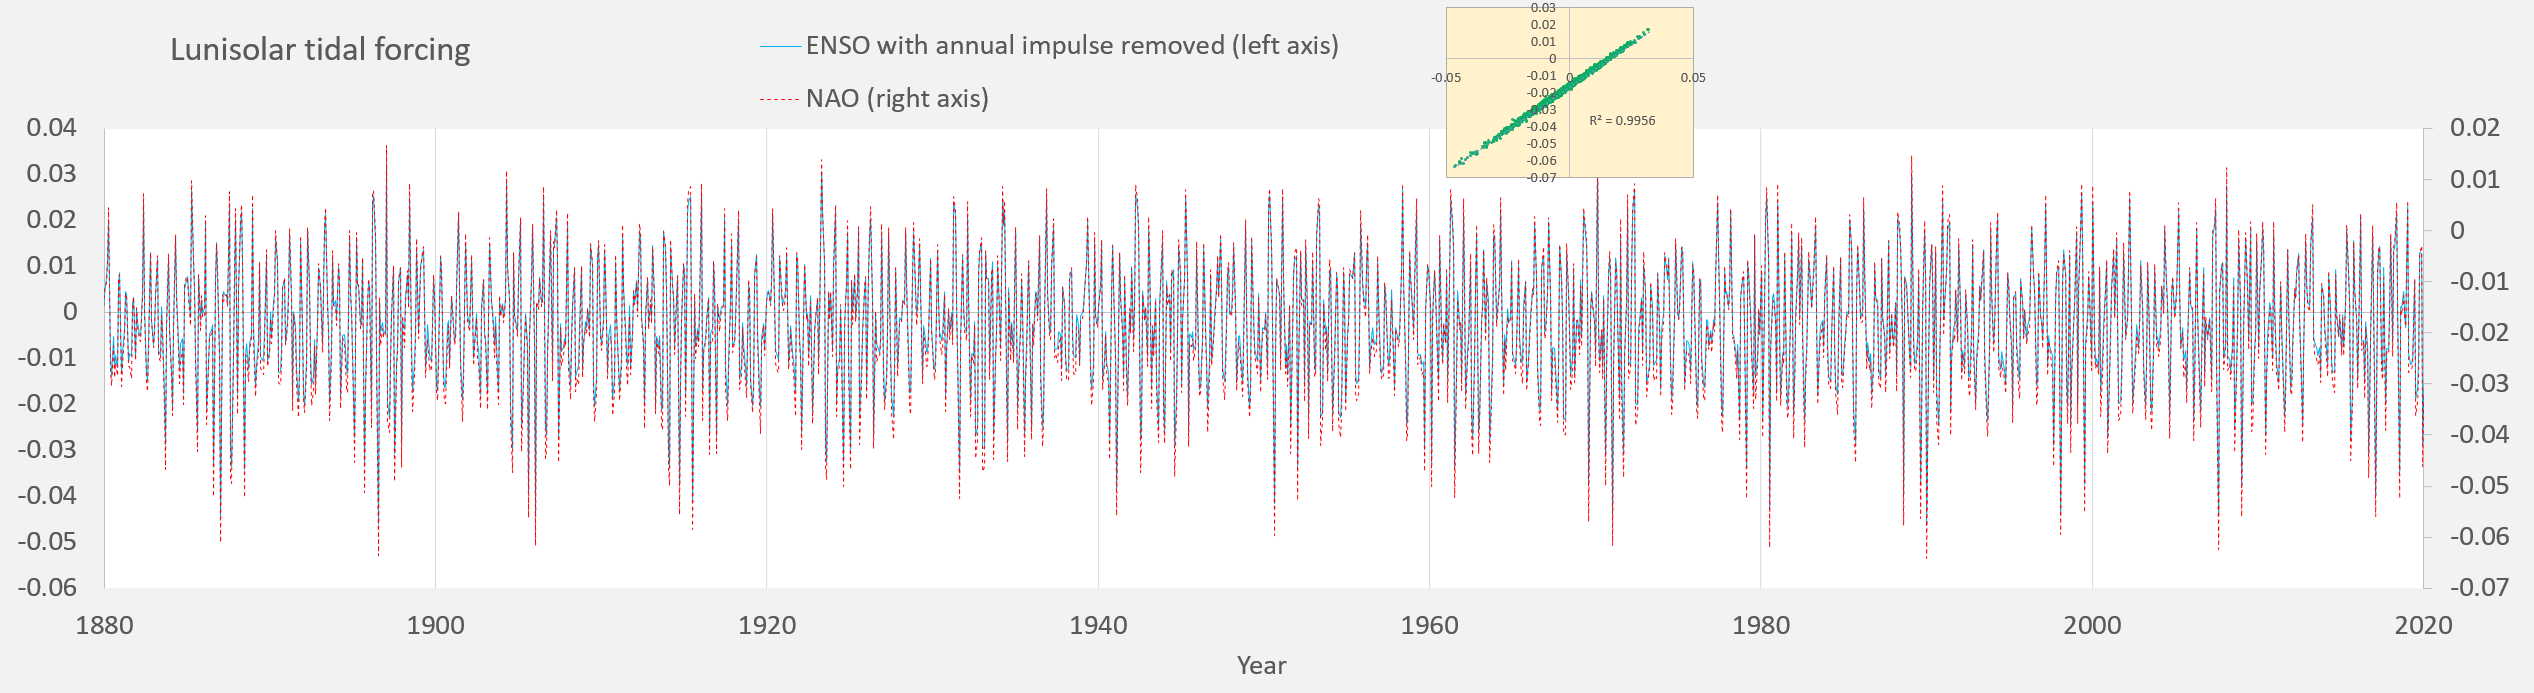
The difference with the NAO solution is that the annual modulation is suppressed and requires not as sharp an annual impulse, resulting in a semiannual sinusoidal modulation along with the monthly values bleeding through to the lag integrator. This sub-annual variation is essentially what generates a faster cycling. Yet, the underlying raw forcing (shown in Fig 3 below with correlation coefficient > 0.99) is identical for the two, reducing the number of degrees of freedom varied during the fit..
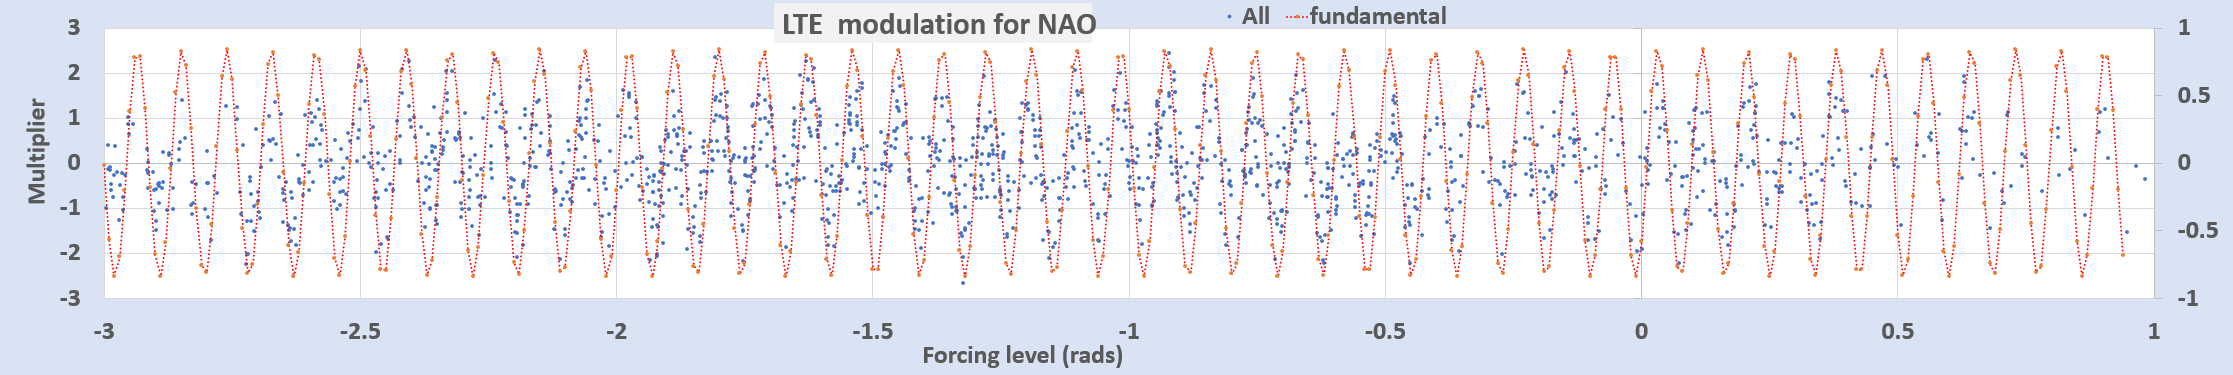
The LTE modulation for NAO is strong, approximately that used for the PDO model (in Fig 2 above). Perhaps this is expected as both NAO and PDO are each northern/higher latitude behaviors.
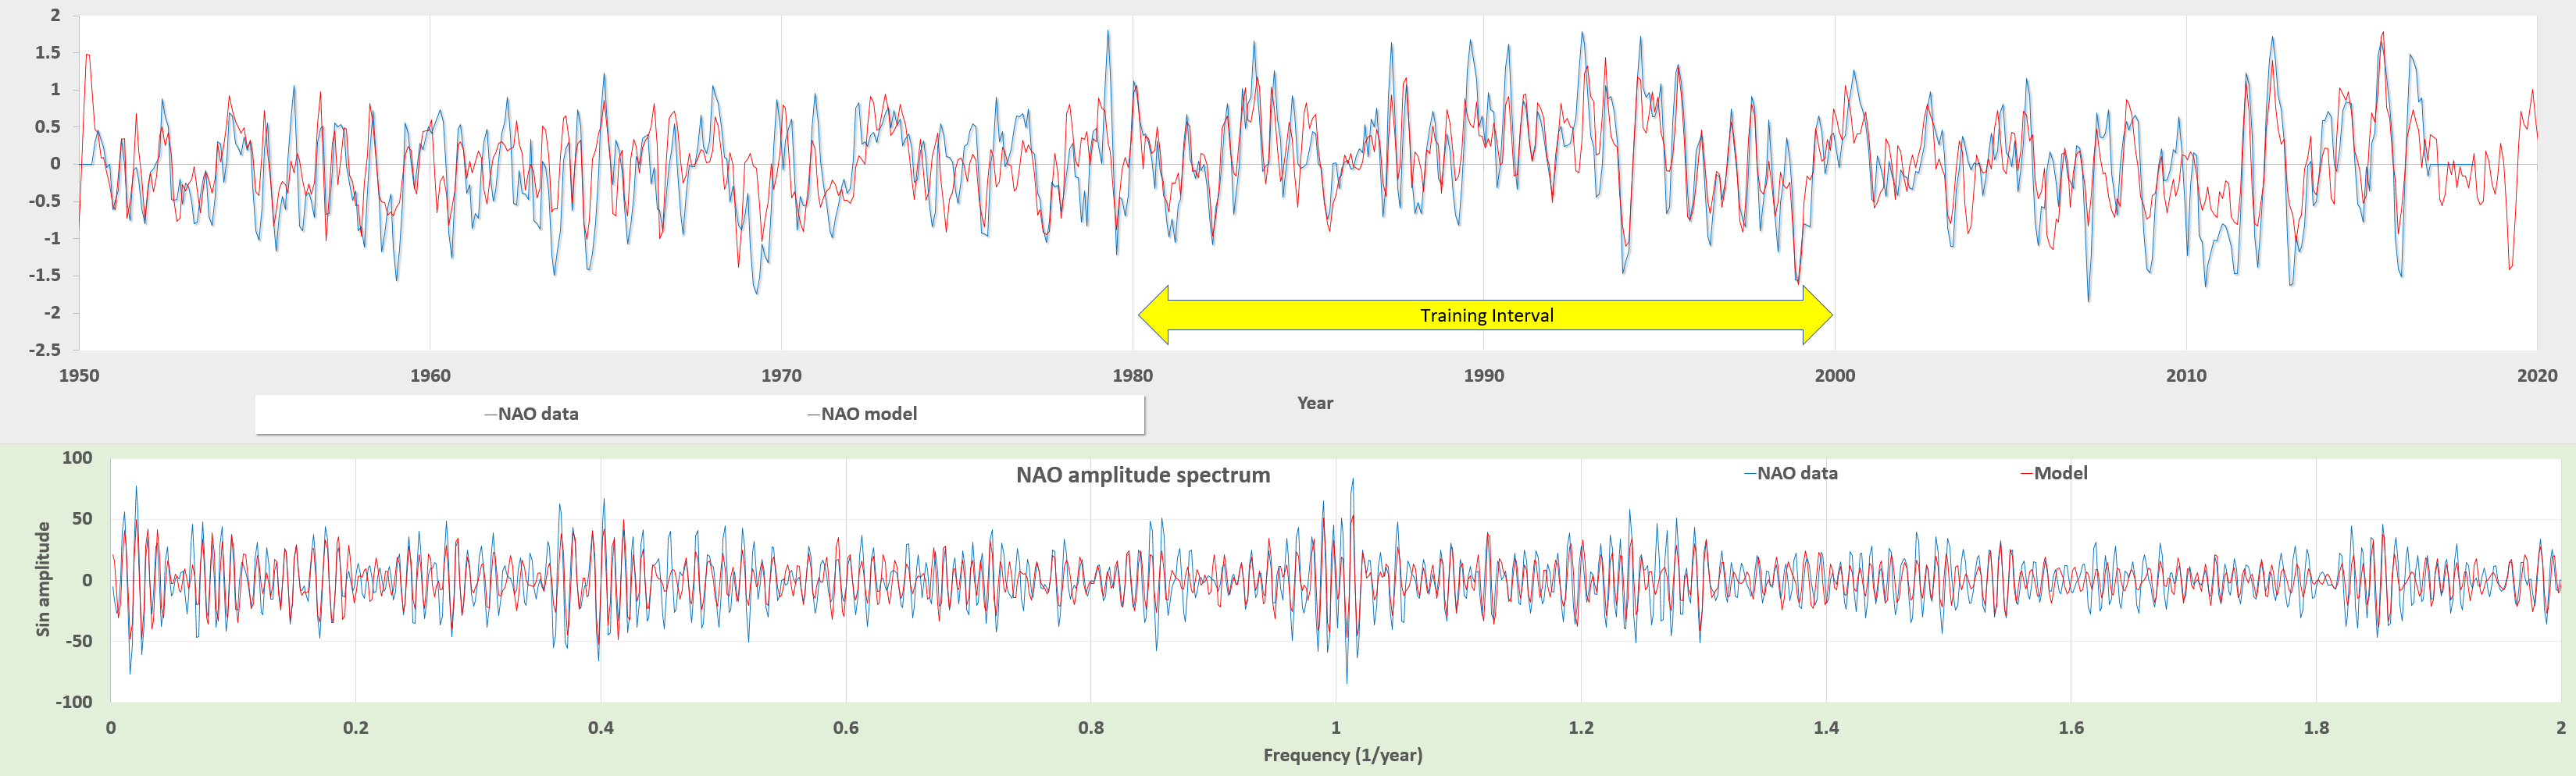
With the LTE modulation providing the primary fitting parameter, the NAO results are better correlated to that published for the AGU presentation. A short cross-validation training interval in Fig 5 is over-fitted but still shows agreement outside of that band.
Summary: It appears that the model for NAO is not as sensitive to sharp annual impulses as the other behaviors (ENSO, PDO, AMO) require for modeling. So instead of an impulse, it appears to more directly correspond to monthly tidal variations with a sinusoidal semi-annual (like for QBO) modulation aiding in the fit. Considering the commonality of the tidal forcing signals within the collection of oceanic indices, the quality of the results indicates that either the LTE approach is meaningful or that we have stumbled on some other pattern that connects the behaviors together.

” EN (El Nino) induces a negative North Atlantic Oscillation (NAO) index throughout boreal winter, which increases approximately linearly with Niño3.4 anomaly by around -0.6 K-1. Only the response to the strongest LN (La Nina) perturbations projects onto a weak positive NAO in November, suggesting the mechanism for the Euro-Atlantic response to LN may be distinct from EN.”
Trascasa-Castro, P., Maycock, A. C., Scott Yiu, Y. Y., & Fletcher, J. K. (2019). On the linearity of the stratospheric and Euro-Atlantic sector response to ENSO. Journal of Climate, (2019).
https://journals.ametsoc.org/doi/abs/10.1175/JCLI-D-18-0746.1
LikeLike
Pingback: The Indian Ocean Dipole | GeoEnergy Math
Pingback: AO, PNA, & SAM Models | GeoEnergy Math
From above ” So instead of an impulse, it appears to more directly correspond to monthly tidal variations with a sinusoidal semi-annual (like for QBO) modulation aiding in the fit.”
This paper shows a connection between QBO and NAO. They find a phase-synchronization by applying a Hilbert transform
Paluš, M. & Novotná, D. Quasi-biennial oscillations extracted from the monthly NAO index and temperature records are phase-synchronized. Nonlinear Processes in Geophysics 13, 287–296 (2006).
LikeLike
Pingback: Highly-Resolved Models of NAO and AO Indices | GeoEnergy Math