As with ENSO, we can train QBO on separate intervals and compare the fit on each interval. The QBO 30 hPa data runs from 1953 to the present. So we take a pair of intervals — one from 1953-1983 (i.e. lower) and one from 1983-2013 (i.e. higher) — and compare the two.
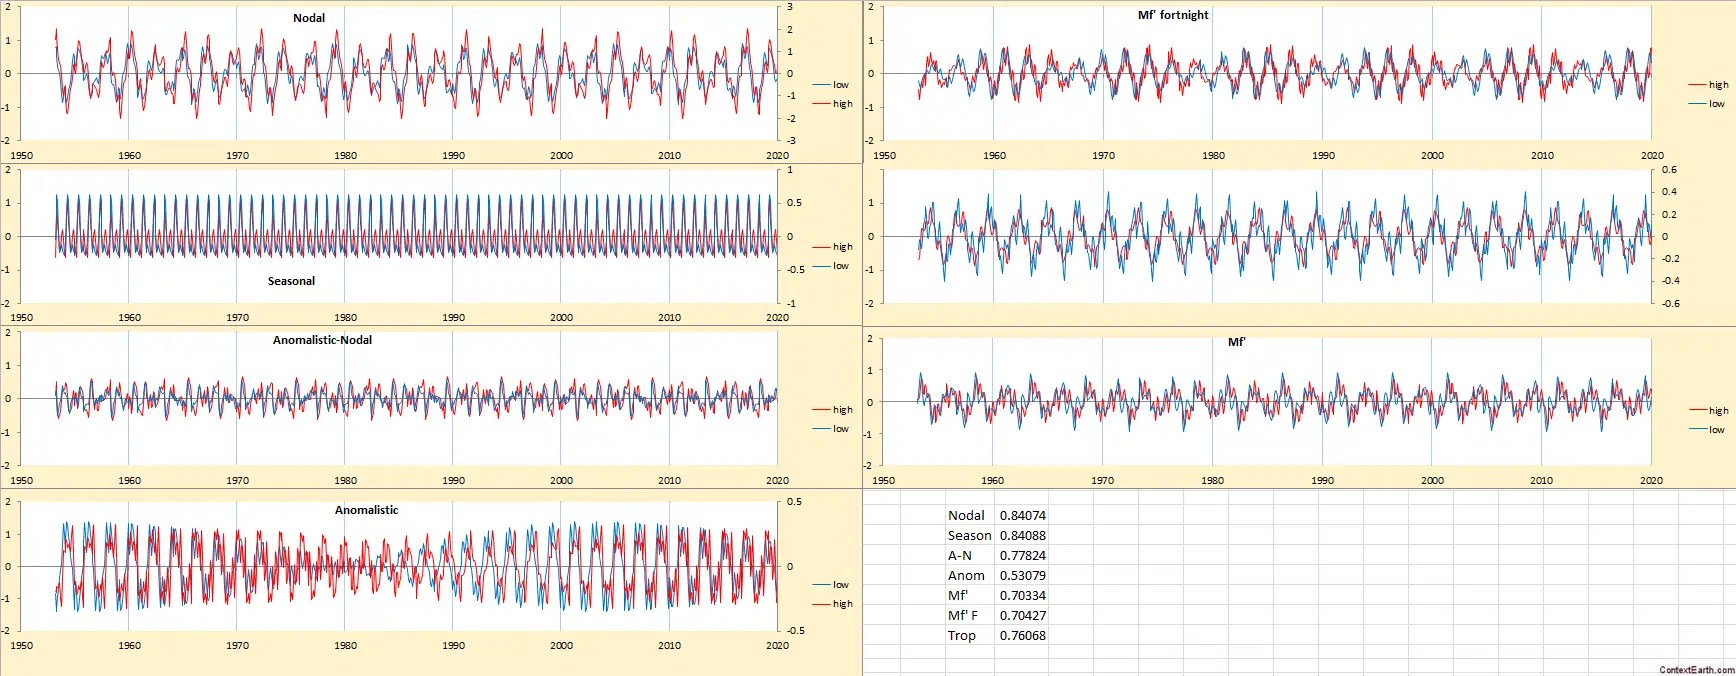
The primary forcing factor is the seasonally aliased nodal or Draconic tide which is shown in the upper left on the figure. The lower interval fit in BLUE matches extremely well to the higher interval fit in RED, with a correlation coefficient above 0.8.
These two intervals have no inherent correlation other than what can be deduced from the physical behavior generating the time-series. The other factors are the most common long-period tidal cycles, along with the seasonal factor. All have good correlations — even the aliased anomalistic tide (lower left), which features a pair of closely separated harmonics, clearly shows strong phase coherence over the two intervals.
That’s what my AGU presentation was about — demonstrating how QBO and ENSO are simply derived from known geophysical forcing mechanisms applied to the fundamental mathematical geophysical fluid dynamics models. Anybody can reproduce the model fit with nothing more than an Excel spreadsheet and a Solver plugin.
Here are the PowerPoint slides from the presentation.

The two intervals used for the fit.
The training region has a correlation coefficient above 0.8 while the validation interval is around 0.6, which indicates that there is likely some overfitting to noise within the training fit.
LikeLike
This is a sanity check to show how bad the result can be if the selected cyclic parameters were not close to optimal. The constituents within the two intervals clash wildly, except for the seasonal signal, which was left in place (there is little doubt that a seasonal effect exists)
LikeLike
What about the QBO disruption last fall. Was that predicted? And ifbyes, what was the mechanism? If no, why the prediction failure?
LikeLike
That’s such an inane question. I will tell you why. Consider this example of an ocean tide measurement
<img src="http://contextearth.com/wp-content/uploads/2016/05/screenshot1.jpg"
Notice that glitch in the center? What is that? I don’t know, perhaps it’s a storm surge?
Does it invalidate the tidal predictions on either side of the glitch? I don’t think so!
Is this QBO model going to be able to model all manner of noise in the system? I don’t think so!
But will it get the long term periodicity correct with a perfectly plausible physical model? Darn tootin it will!
LikeLike
Pingback: Tidal Model of ENSO | context/Earth